Bitcoin (BTC/USD) Talking Points:
- Bitcoin prices rises above key Fibonacci resistance after US CPI (Consumer Price Index) favored speculative
- USD gains slightly after sliding against its major counterparts
- Price action stalls, can bulls reclaim the critical psychological level of $50,000?


Bitcoin (BTC/USD) has risen above critical resistance after the US CPI print boosted demand for speculative assets.
With inflationary pressures on the rise, next week’s FOMC meeting minutes (22 September) could be a make or break for digital assets if the Federal Reserve hints at near-term tapering.
However, with softer CPI’s pushing out expectations of tapering, Bitcoin and Ethereum have managed to hold on to recent gains, at least for now.
Visit DailyFX Education to discover the importance of macro-fundamentals in global markets


Bitcoin (BTC/USD) Price Action
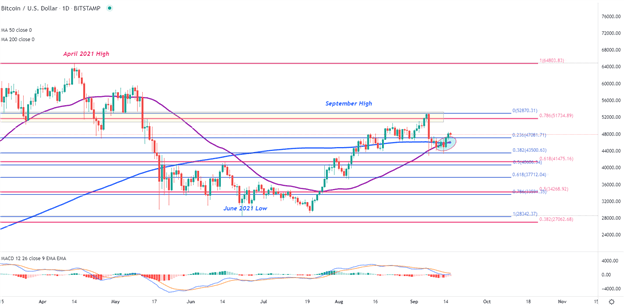
After the formation of a golden cross on the daily chart, Bitcoin prices have risen above the 23.6% Fibonacci retracement level of the June – September move at $47,000, in an effort to reclaim the key psychological level of $50,000 mark which remains as critical resistance for both the short and longer-term move.
With price action currently encapsulated between prominent levels, the ability to break above the key psychological level of $48,000 may give rise to further bullish momentum and a possible retest of $50,000 and a probable drive towards the next key Fibonacci resistance level of $51,734.
Bitcoin (BTC/USD) Daily Chart

Chart prepared by Tammy Da Costa using TradingView
--- Written by Tammy Da Costa, Analyst for DailyFX.com
Contact and follow Tammy on Twitter: @Tams707


