


NATURAL GAS (HENRY HUB) ANALYSIS
- LNG looks fundamentally bullish
- Low storage - supportive of sustained upward price action
- Key technical level breaks could prompt significant price moves
LNG FUNDAMENTAL BACKDROP
LNG spot prices have surged fresh highs last seen in 2018. Fundamentally, demand from East Asia and the Pacific (green) region on the chart below has steadily increased. Asia is entering their summer period which traditionally comes with higher LNG demand due to rising temperatures. The Asian region is important to overall natural gas consumption as Japan and China are two of the largest importers of LNG globally. Weather analytics will play a key role as the Asian summer develops because any unexpected rise in summer temperatures could spark unforeseen demand.
LNG EXPORTS BY REGION
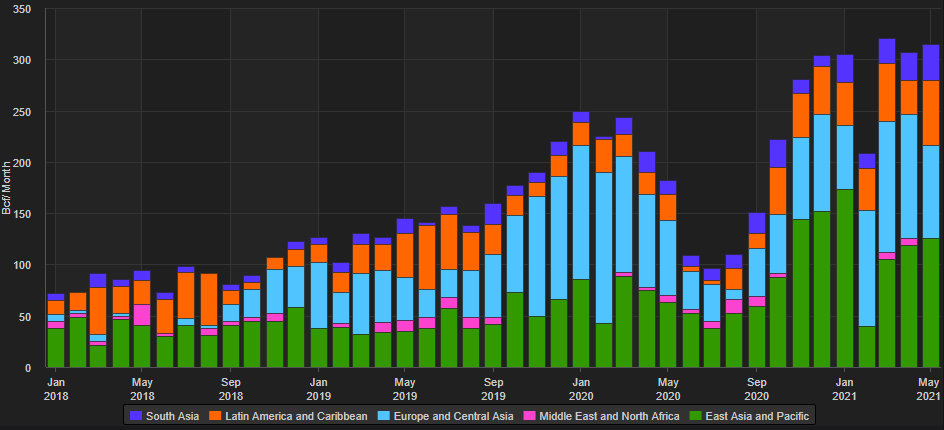
Chart prepared by Warren Venketas,Refinitiv
The supply side shows a slight uptick in inventory as per last week however, compared to last year and the 5-year average current inventory data is significantly lower. This supports the present bullish bias surrounding LNG spot prices.
LNG STORAGE DATA
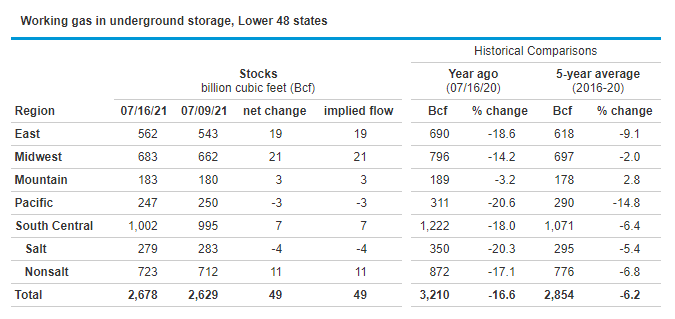
Chart prepared by Warren Venketas,EIA
Enhance your knowledge on Natural Gas with my Top Trading Strategies and Tips !
NATURAL GAS TECHNICAL ANALYSIS
Natural Gas Weekly Chart:
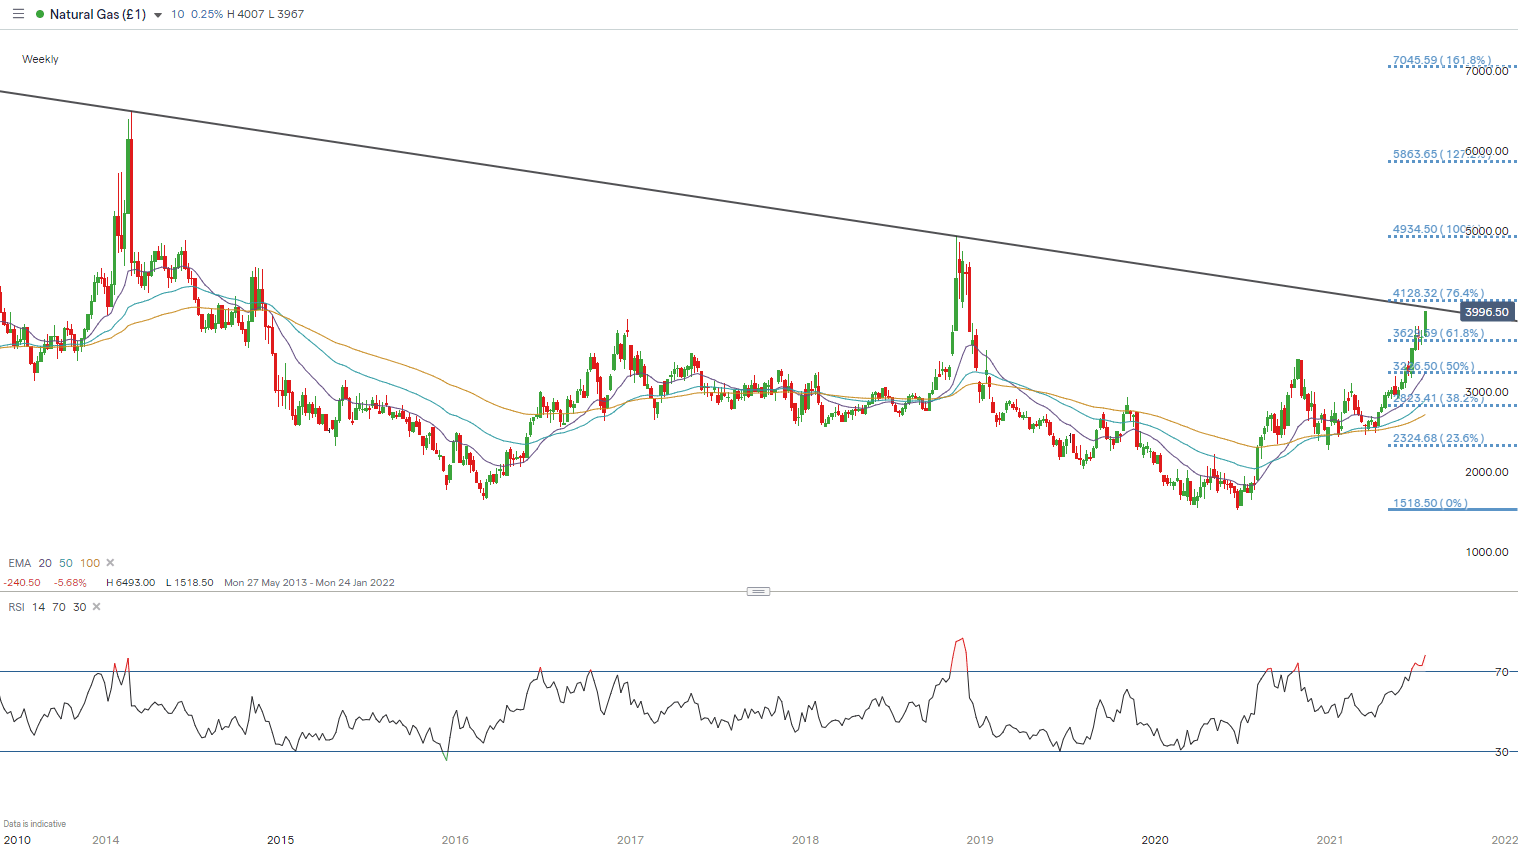
Chart prepared by Warren Venketas, IG
The weekly natural gas chart highlights the long-term trendline resistance level (black) that has previously been tested in late 2018. This trendline has held firmly for many years and recently has come into consideration as a consequence of bullish LNG price action. The 4.000 psychological zone coincides with trendline resistance which could be key should prices close higher at the weeks close.
Natural Gas Daily Chart:
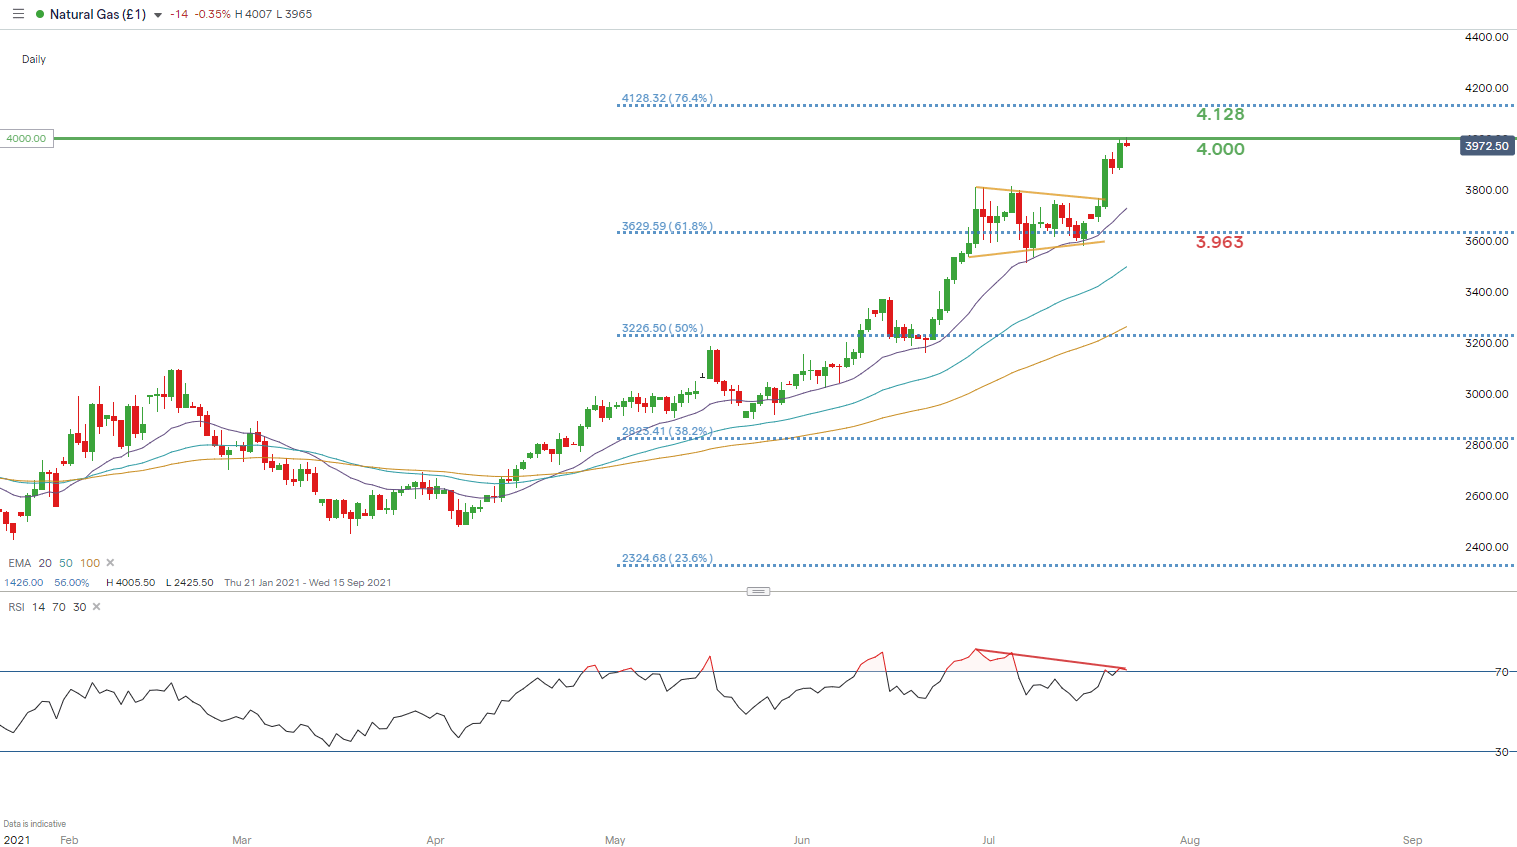
Chart prepared by Warren Venketas, IG
The daily chart illustrates the strong upward move earlier this week as LNG prices broke above the rectangle pattern (yellow). Bullish momentum seems to be slowing according to the Relative Strength Index (RSI) which opposes current price action. Opposing movements between the two point to divergence – more specifically bearish divergence which may see prices retrace lower.
Bears will be looking for a reversal with the 20-day EMA as initial support after which the 61.8% Fibonacci at 3.963 will come into consideration – Fibonacci taken from November 2018 high to June 2020 low.
From the bullish perspective, a break above 4.000 could support further upside towards the 76.4% Fibonacci at 4.128.
--- Written by Warren Venketas for DailyFX.com
Contact and follow Warren on Twitter: @WVenketas


