


GOLD FORECAST: XAU/USD PRICE ACTION EXPLOITING US DOLLAR WEAKNESS
- Gold price action is up over 12% since forming a double-bottom near $1,680/oz
- XAU/USD has likely piggybacked on US Dollar weakness and lower real yields
- Gold outlook remains bright, but the precious metal does seem a bit extended
Gold price action extended its climb for the fourth consecutive trading session on Tuesday. XAU/USD gained 0.14% to trade at fresh 16-week highs near the $1,870-price level. The precious metal is now up more than 12% since it formed a double-bottom chart pattern in March. US Dollar weakness and lower real yields stand out as two primary drivers of gold buying pressure. I recently noted how an acceleration in gold volatility stood out as another bullish catalyst for XAU/USD.

XAU/USD – GOLD PRICE CHART: WEEKLY TIME FRAME (25 NOV 2020 TO 18 MAY 2021)
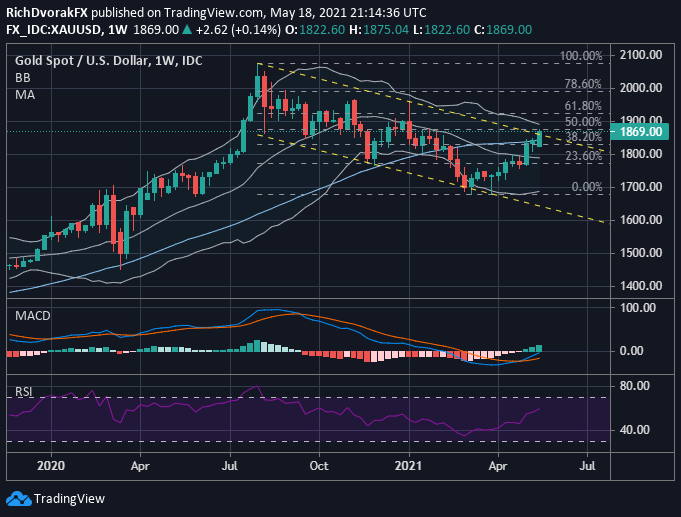
Chart by @RichDvorakFX created using TradingView
Gold prices are starting to look vulnerable to a slight pullback, however, as the precious metal contends with technical resistance posed by its descending channel, upper Bollinger Band, and mid-point retracement of the August 2020 to March 2021 trading range. The relative strength index on a daily gold chart also speaks to ‘overbought’ conditions. If a pullback does materialize, gold bulls might consider playing the psychologically-significant $1,800-price level as a potential support level.
| Change in | Longs | Shorts | OI |
| Daily | 1% | -3% | -1% |
| Weekly | 2% | -8% | -2% |
Keep Reading – US Dollar Outlook: DXY Index Hammered as Treasury Yields Ebb
-- Written by Rich Dvorak, Analyst for DailyFX.com
Connect with @RichDvorakFX on Twitter for real-time market insight


