US DOLLAR PRICE OUTLOOK: DXY INDEX HITS 12-WEEK LOW AS INFLATION FEARS WANE
- US Dollar bears drive the Greenback down to its weakest level since late February
- DXY Index now trades in the red year-to-date after falling -4% from its March peak
- Softer Treasury yields due to less fear of Fed tapering likely fueling USD weakness
- Visit the DailyFX Education Center or check out these US Dollar trading strategies
The US Dollar is continuing its slide on Tuesday as bears steer the broader DXY Index to fresh 12-week lows. US Dollar selling pressure has been felt across the board of major currency pairs on the session, though the Greenback has weakened particularly against the Euro with EUR/USD up about 60-pips intraday. Seeing that EUR/USD price action is the largest component of the DXY Index, this has largely helped strongarm the broader US Dollar lower.


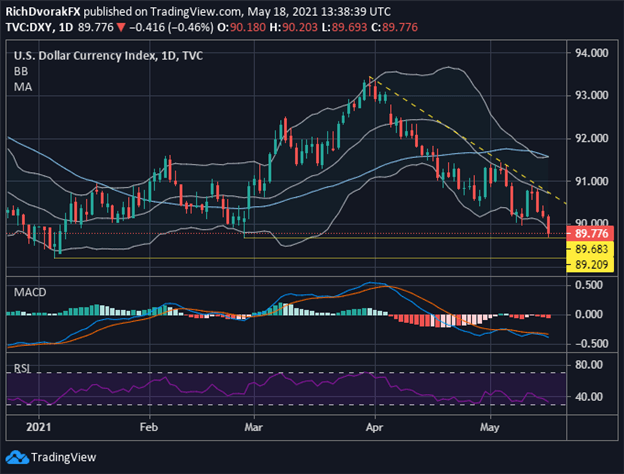
The latest extension of US Dollar weakness leaves the DXY Index on pace for its fourth-consecutive decline and trading in negative territory year-to-date. This could follow Treasury yields pulling back slightly with the ten-year shedding about 6-basis points after failing to eclipse 1.7%. Perhaps waning fears of inflation and Fed taper risk explain these moves as I previously noted how US Dollar outlook hinges on Treasury yield volatility (and lack thereof).
DXY – US DOLLAR INDEX PRICE CHART: DAILY TIME FRAME (24 DEC 2020 TO 18 MAY 2021)

Chart by @RichDvorakFX created using TradingView
That said, the broader US Dollar is looking a bit extended here as the relative strength index flirts with ‘oversold’ territory. Also, there appears to be two glaring technical support levels that US Dollar bulls might look to defend. First and foremost is the 89.70-price level on the DXY Index, which is underpinned by the 25 February swing low. The bottom Bollinger Band might help stem US Dollar selling pressure as well. Invalidating technical support provided by the 89.70-price level, however, would likely open the door for US Dollar bears to target the 06 January swing low.
Learn More – Improve your Technical Analysis with DailyFX Education
On the other hand, DXY Index rebound efforts could bring a test of the negatively-sloped 20-day simple moving average into focus. Surmounting bearish trendline resistance might coincide with follow-through higher toward the 50-day moving average. Nevertheless, in order to help gauge where the DXY Index heads next, I would continue to keep close tabs on Treasury yields and their generally strong direct relationship with the broader US Dollar.


-- Written by Rich Dvorak, Analyst for DailyFX.com
Connect with @RichDvorakFX on Twitter for real-time market insight


