


S&P 500 Index May Extend Higher as Nikkei 225, Hang Seng Index Consolidate
S&P 500 Index
The S&P 500 index is riding an ascending trend higher and may attempt to challenge a psychological resistance level at 4,000 (the 100% Fibonacci extension of the past year’s first phase rally). Breaking this boundary may open the door for further upside potential with an eye on 4,290 – the 127.2% Fibonacci extension on the same run. The overall trend retains a bullish bias as the index forms consecutive higher highs and lows since rebounding from its March 2020 trough.
Looking ahead, the upward trajectory remains intact for the US stock market, although some technical pullbacks are possible into the second quarter of 2021. Europe is facing a third viral wave amid a slowdown in vaccine progress, while the economic recovery around the world is likely to be uneven and prolonged. Reflation hopes and the inflation outlook may continue to boost longer-term bond yields, which are likely to exert pressure on growth stocks.
The S&P 500 registered an astonishing 80% gain over the past 12 months, underpinned by ultra-loose monetary policy and recovery prospects. On the weekly chart, the ascending trend showed no sign of stopping soon as the 4- and 10-week Simple Moving Average (SMA) lines are trending higher. Still, traders should be vigilant about short-term pullbacks if profit-taking kicks in.
S&P 500 Index – Weekly Timeframe (2019 to 2021)
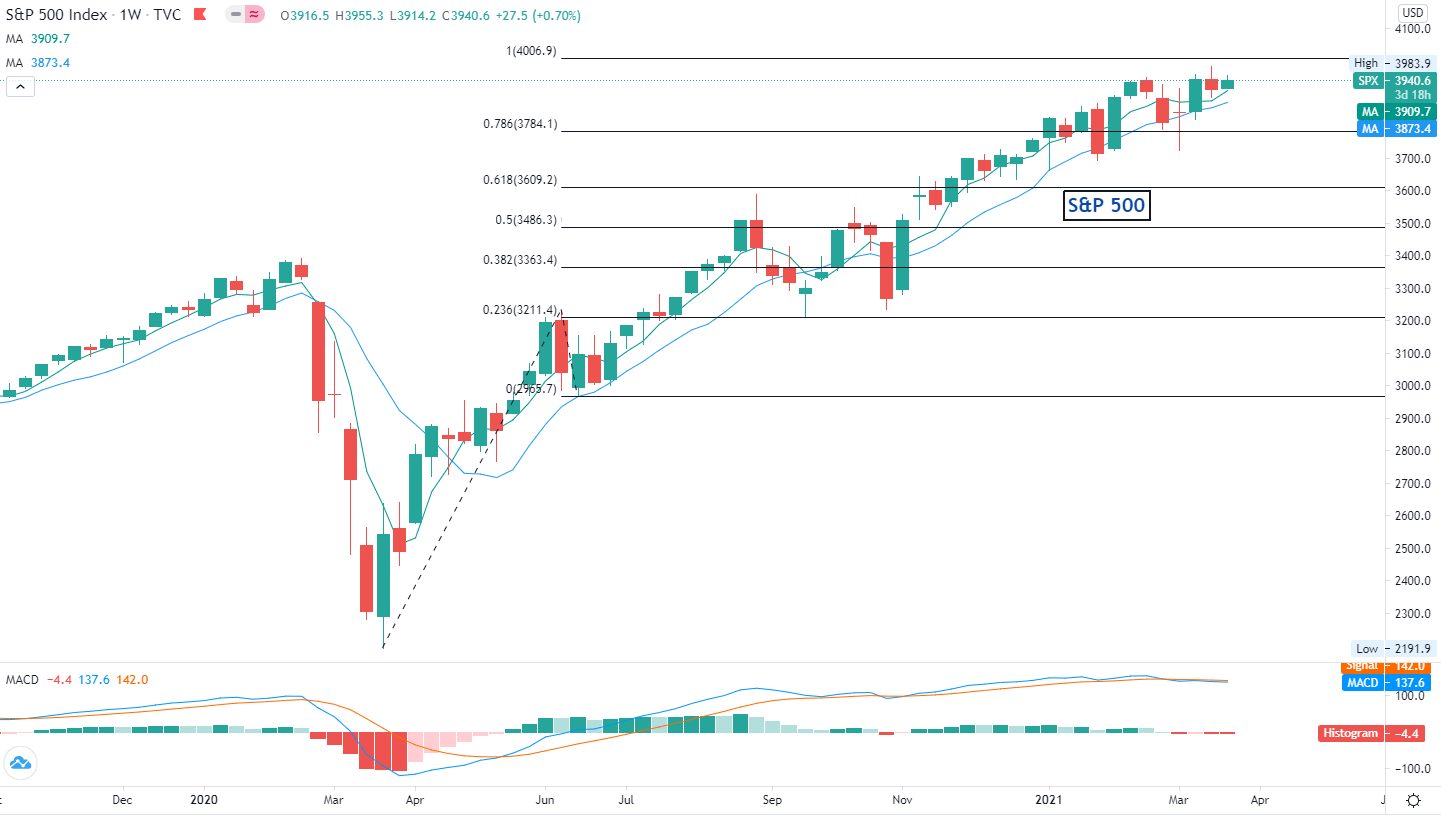
Source: TradingView
Nikkei 225 Index
The Nikkei 225 failed to breach the 127.2% Fibonacci extension level of the March-June advance (30,200) and has retreated slightly on the weekly chart. The MACD indicator is about to form a bearish crossover, suggesting that upward momentum is fading and a deeper pullback is possible. A technical correction may not derail the index’s upward trajectory in the medium term, however, as suggested by the rising 10- and 20-week SMA lines.
Looking ahead, current consolidation may pave the way for higher highs should a robust global economic recovery drive up demand for Japanese exports and services.
Nikkei 225 Chart – Weekly Timeframe (2019 to 2021)
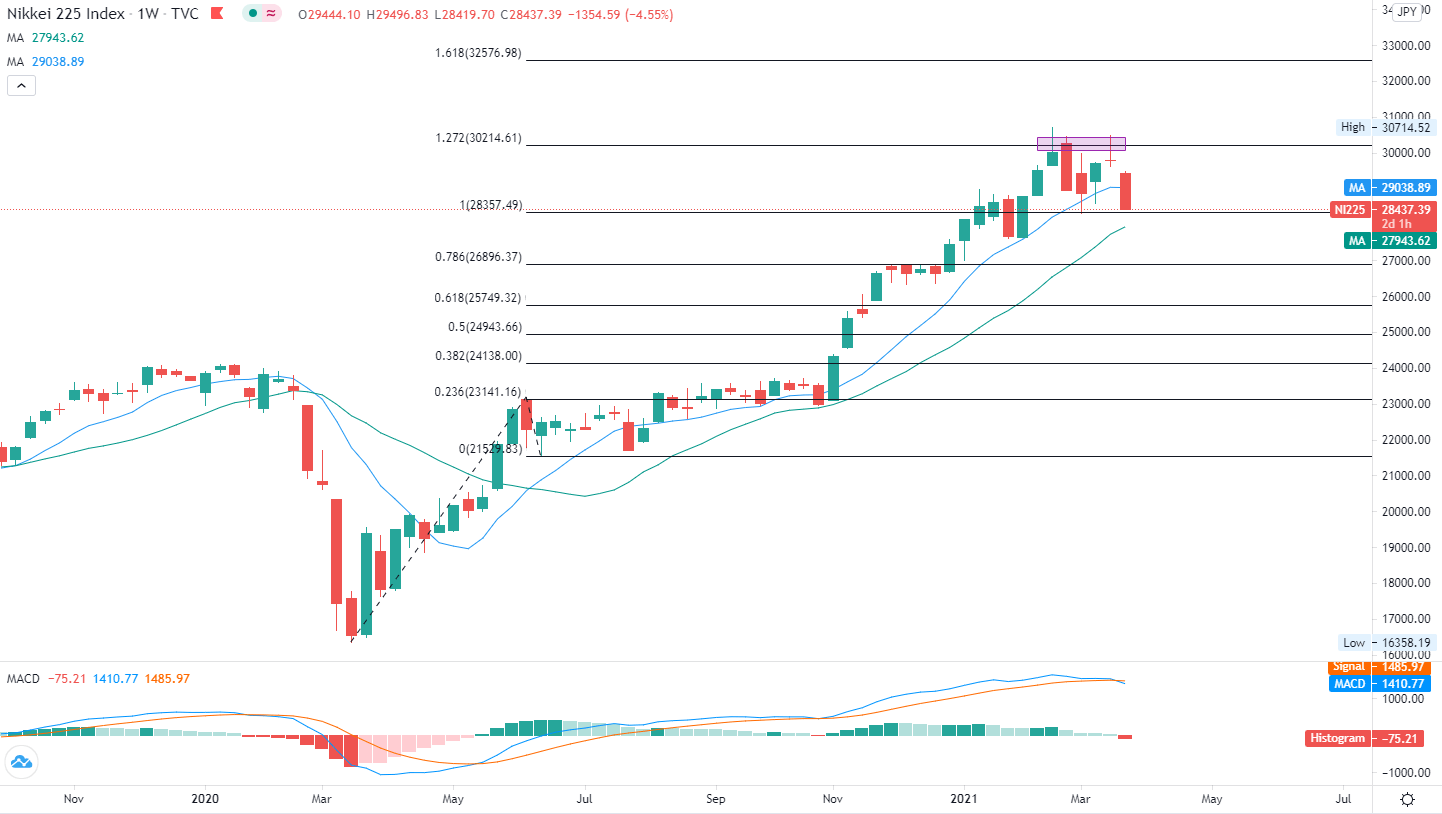
Source: TradingView
Hang Seng Index
Hong Kong’s Hang Seng Index (HSI) breached a major “Descending Channel” in early 2021 before prices entered a consolidative period. Recently, selling pressure appears to be gaining momentum, as suggested by the formation of a bearish MACD crossover.
Looking ahead, a firm break below the 23.6% Fibonacci retracement (28,800) would likely intensify selling pressure and expose the next key support level at 27,350 (the 38.2% Fibonacci retracement). Holding above the ceiling of the “Descending Channel” may pave the way for a price rebound should market sentiment recover.
Hang Seng Index – Weekly Timeframe (2019 to 2021)
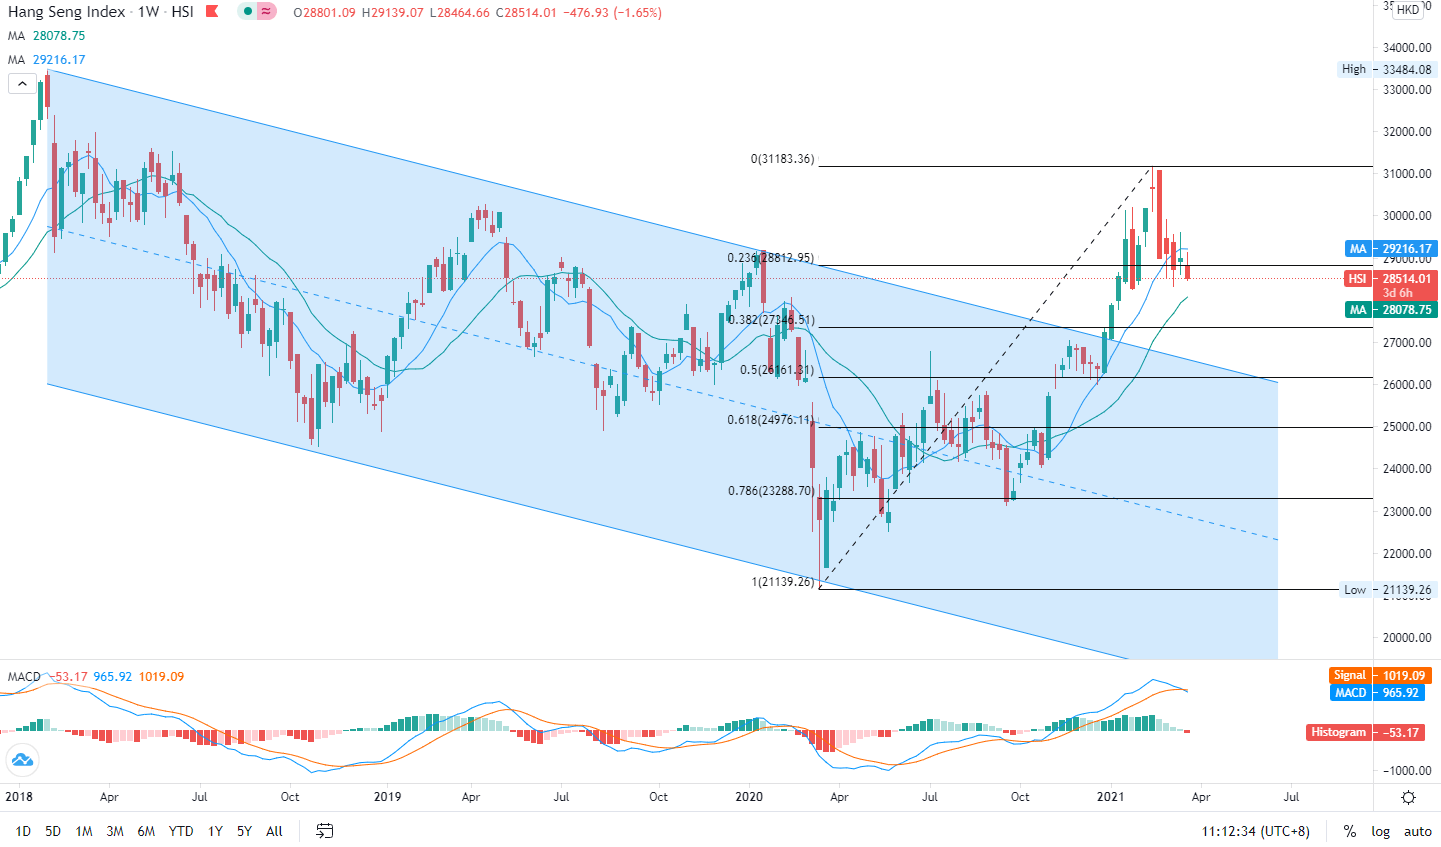
Source: TradingView


