


Bitcoin (BTC/USD), Ethereum (ETH/USD) Forecast:
- Bitcoin bulls drive price action into a wall of resistance
- Ethereum soars ahead of futures listing
- Price Action has remained generally bullish
Bulls trading both Bitcoin and Ethereum remain in control of price action after prospects of the larger US Fiscal Stimulus package helped to buoy the demand for major cryptocurrencies. Although Bitcoin has surged approximately 23% (YTD), Ether continues to outperform, rising a massive 123% (YTD).
Bitcoin (BTC/USD) Price Action
After retracing from the record high set in early January, Bitcoin bulls managed to bounce off of the 50% Fibonacci retracement level of the November- January move, driving price action into a wall of resistance, formed by the key psychological level of $38,000, . With prices threatening to break above the upper bound of the Bollinger band, the Commodity Channel Index (CCI) currently rests at 100, highlighting that BTC/USD may not be as overbought as it was earlier this week.

Bitcoin 4 Hour Chart
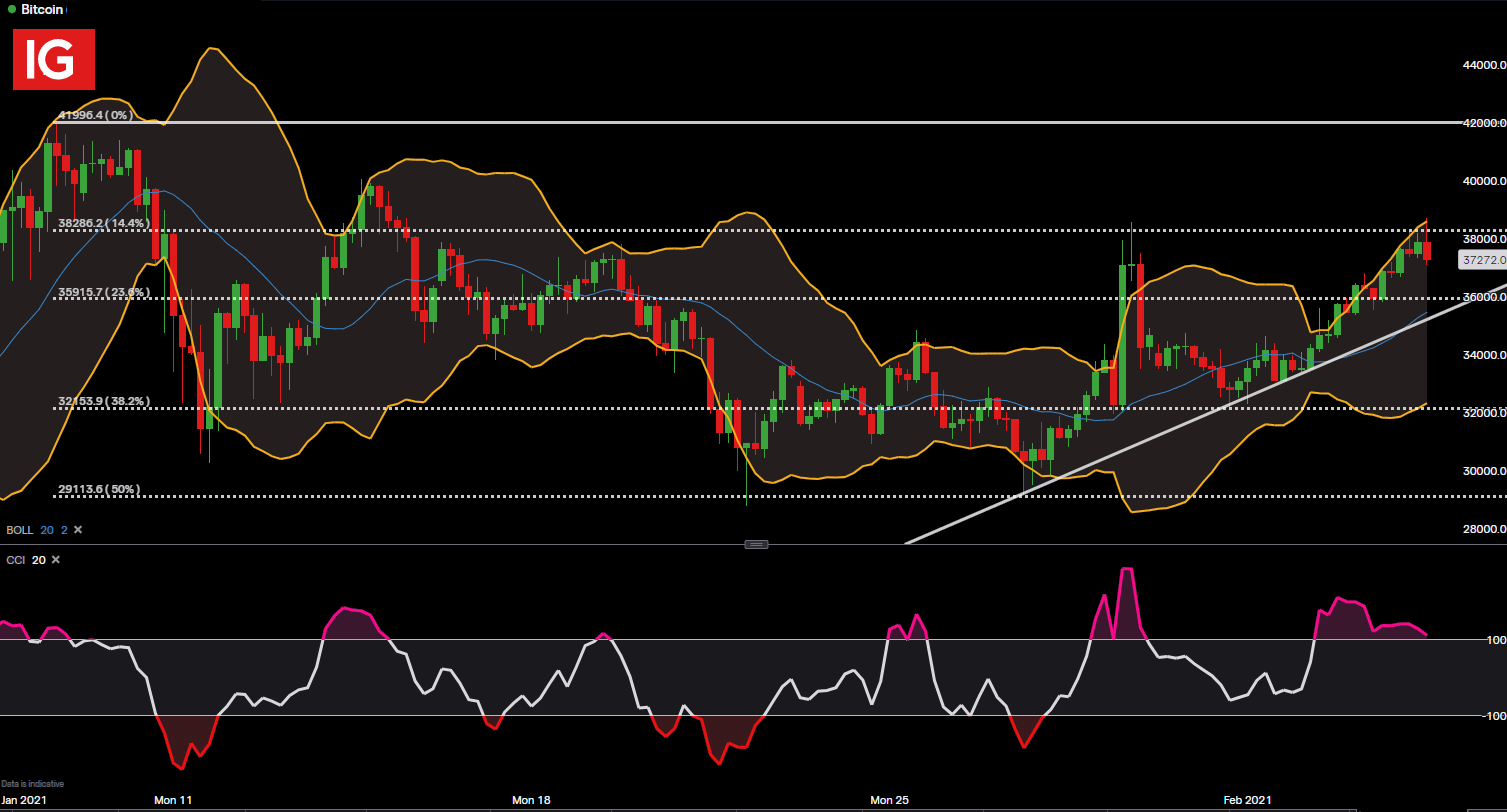
Chart prepared by Tammy Da Costa, IG
For bullish continuation to persist, bulls need to push above the current resistance level of $38,000, with the next level of resistance showing around the psychological level of $40,000.
On the other side, for bears to take over, they would need to push below the current support of $35,915, formed by the 23.6% Fibonacci retracement, with the next level of support holding at the 38.2% Fibonacci retracement level of $32,153
Ethereum (ETH/USD) Price Action
ETH/USD continues to soar ahead of next week’s launch of Ethereum futures on the Chicago Mercantile Exchange (CME). After peaking at the key psychological level of $1,700, a new record high, prices retraced back towards the current support level of $1,468, formed by the 14.4% Fibonacci retracement level of the historical move. Meanwhile the CCI remains within range, falling below the 100 mark.

Ether (ETH/USD) 4 Hour Chart
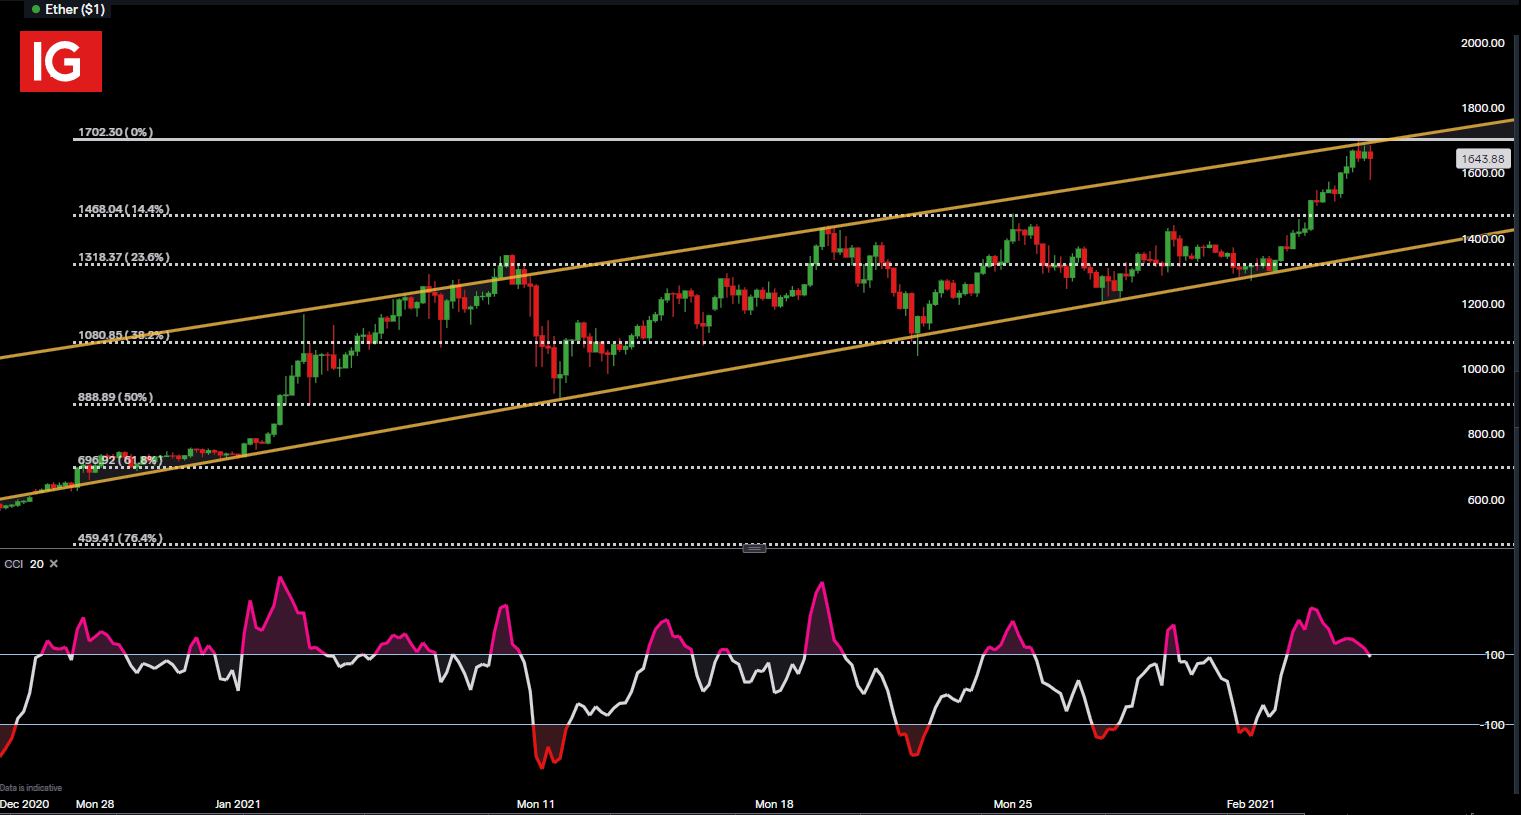
Chart prepared by Tammy Da Costa, IG
--- Written by Tammy Da Costa, Market Writer for DailyFX.com
Contact and follow Tammy on Twitter: @Tams707


