


FTSE, GBP Sentiment Talking Points:
- GBP/USD: Strong long-term uptrend – 69% short positioning
- GBP/JPY: Uptrend facing resistance – 67% short positioning
- FTSE 100: Bull flag intersects trendline support – 70% long positioning
GBP/USD Sentiment Analysis
Summary: Long-term bullish trend considered alongside daily and weekly surge in short positioning suggests a bullish trading bias according to the IG Client Sentiment report
Cable has continued its long-term uptrend. The chart below shows how price action has traded within an ascending channel with regularity as higher highs and higher lows were established. Yesterday, after bouncing off of channel support, the market breached the 1.3700 level.
Previously we mentioned that a break above 1.3700 may interest bulls, bringing the 1.3800 level of resistance into focus. However, it must be noted that the pair has struggled to reach the upper side of the ascending channel recently which may indicate a slow down in bullish momentum in the near term.
Read our latest GBP analysis from Martin Essex
GBP/USD Daily Chart
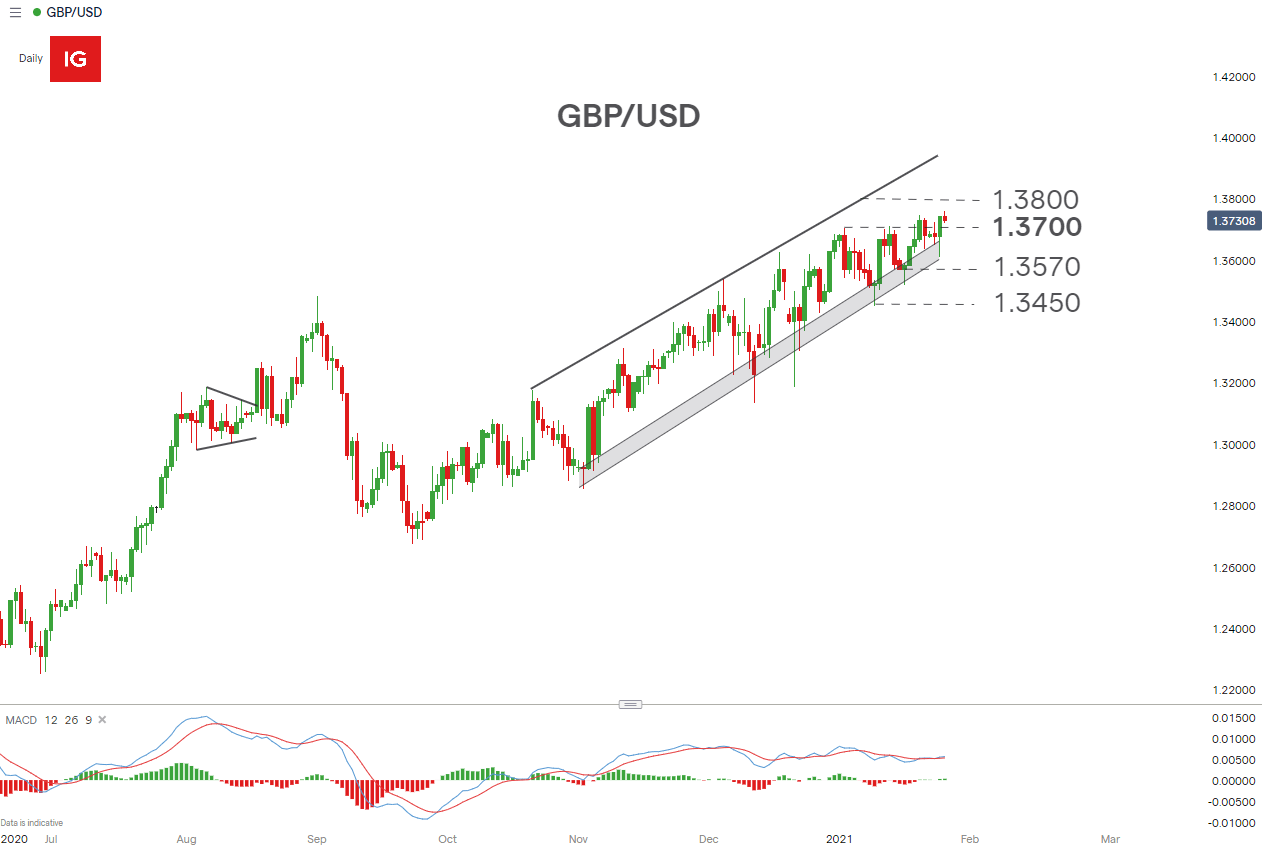
Chart prepared by Richard Snow, IG
- Trader net positioning: 69% short (bullish according to contrarian analysis)
- Daily Changes in longs/shorts: -15.2%/+42.21%
- Weekly changes in longs/shorts: - 25.91%/+53.77%
Positioning remains short, in aggregate, despite long-term uptrend


GBP/JPY Sentiment Analysis
Summary: September high may present short-term resistance to the bull trend. Despite majority short positioning, recent mixed changes in client sentiment suggest a mixed trading environment according to the IG Client Sentiment report
The recent break above trendline support buoyed bulls as a gradual move higher ensued. However the September swing high at 142.70 looks to be the next level of resistance and may prove difficult to breach.
The stochastic oscillator remains in overbought territory – although this is possible for extended periods- and serves as a potential warning that the 142.70 level may keep bulls at bay for now.
GBP/JPY Daily Chart
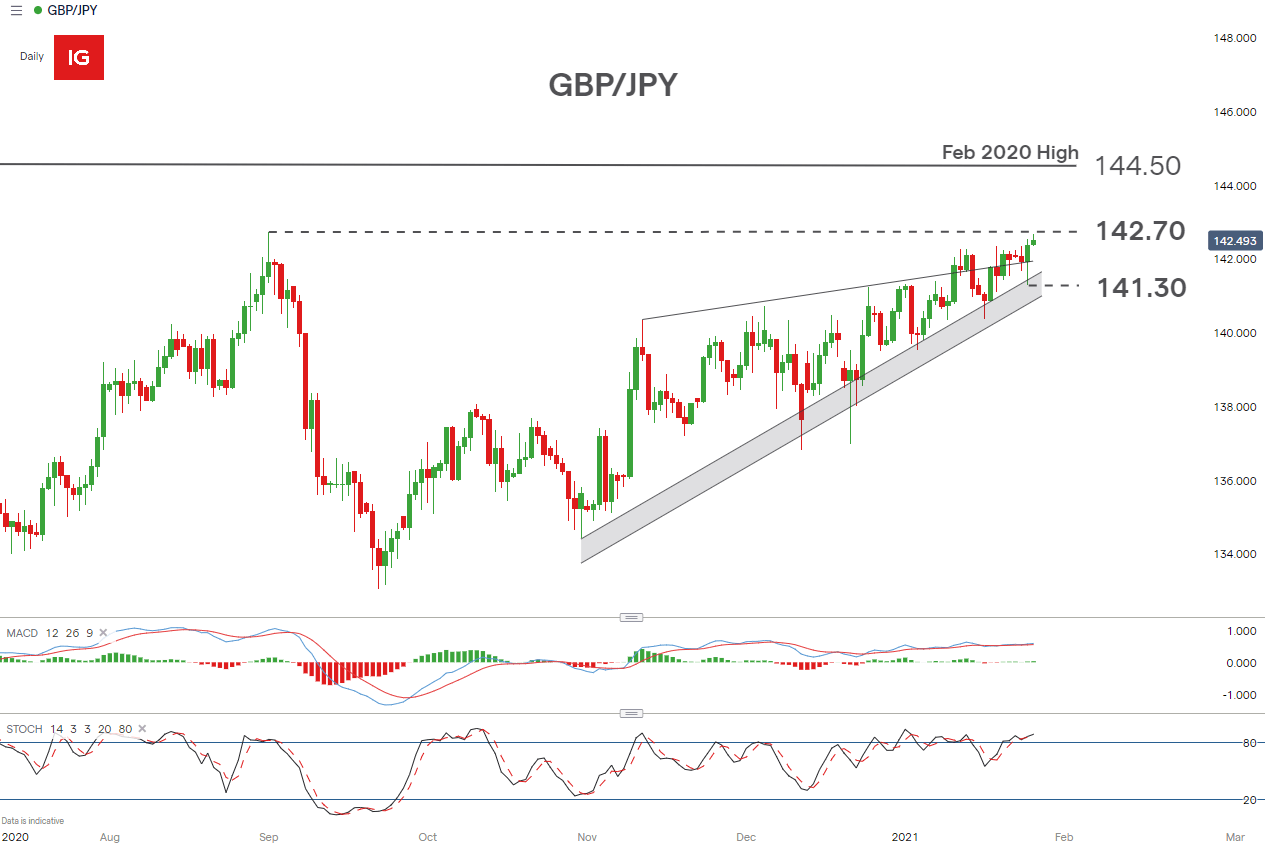
Chart prepared by Richard Snow, IG
- Trader net positioning: 67% short (bullish according to contrarian analysis)
- Daily Changes in longs/shorts: +20.48%/+18.6%
- Weekly changes in longs/shorts: - 8.12%/+12.44%
Positioning remains short, in aggregate, despite long-term uptrend


FTSE Sentiment Analysis
Summary: Recent increases in longs and overall long sentiment, despite the appearance of a bull flag suggest a bearish trading bias according to the IG Client Sentiment report
It’s unsurprising to see the equity index trading lower as the Pound Sterling moves higher. This is due to the existence of stocks with sizeable earnings denominated in foreign currency. When Sterling appreciates this results in fewer Pounds received for every unit of foreign currency.
While the FTSE is still largely seen to be in a long-term uptrend, we have witnessed a retracement in the form of a bull flag which is converging with the ascending trendline and an area of significance around the 6605 level.
Sterling depreciation may provide a catalyst for bullish continuation off these levels however, this remains to be seen. Additionally the stochastic indicator has just entered into oversold territory, something that FTSE bulls will surely be monitoring.
FTSE 100 Daily Chart

Chart prepared by Richard Snow, IG
- Trader net positioning: 70% long (bearish according to contrarian analysis)
- Daily changes in longs/shorts: +2.01%/ -8.26%
- Weekly changes in longs/shorts: +7.60%/-13.99%
Positioning remains largely long, in aggregate, in line with the long-term uptrend

--- Written by Richard Snow for DailyFX.com
Contact and follow Richard on Twitter: @RichardSnowFX


