


Swiss Franc Technical Analysis, CHF/JPY, CAD/CHF, NZD/CHF – Talking Points
- CHF/JPY aiming to break above 2020 closing high on bullish MACD crossover
- CAD/CHF Symmetrical Triangle constricts price action, breakout may be near
- NZD/CHF price may moderate before giving way back to longer-term trend
CHF/JPY Technical Analysis
The Swiss Franc continues to put on an impressive display of strength against the Japanese Yen as CHF/JPY moves within striking distance of the current 2020 closing high following a multi-week rally in the cross. Given recent strength, CHF/JPY buyers will likely attempt a run for the 2017-2018 highs at 118.605-118.558. A bullish Simple Moving Average crossover formed in September, along with a very recent MACD crossover on the weekly chart. These may give bulls the technical backdrop to run higher yet.
CHF/JPY Weekly Chart

Chart created with TradingView
CAD/CHF Technical Analysis
The Swiss Franc’s technical position against the Canadian Dollar is likely nearing a decisive moment with a Symmetrical Triangle formation stemming from March constricting current prices. CAD/CHF bulls mounted several incursions higher throughout November, but the pattern’s upper-bound proved resilient.
Since then, CAD/CHF eased to the downside where support appears to be offered by the 50-day SMA, and 38.2% Fibonacci retracement from the February-March range. The broader move may lean to the bullish side, however, following a Golden Cross with the 50-day SMA crossing above the longer-term 200-day this month. A breakout would require prices to breach the triangle’s upper-bound.

CAD/CHF Daily Chart
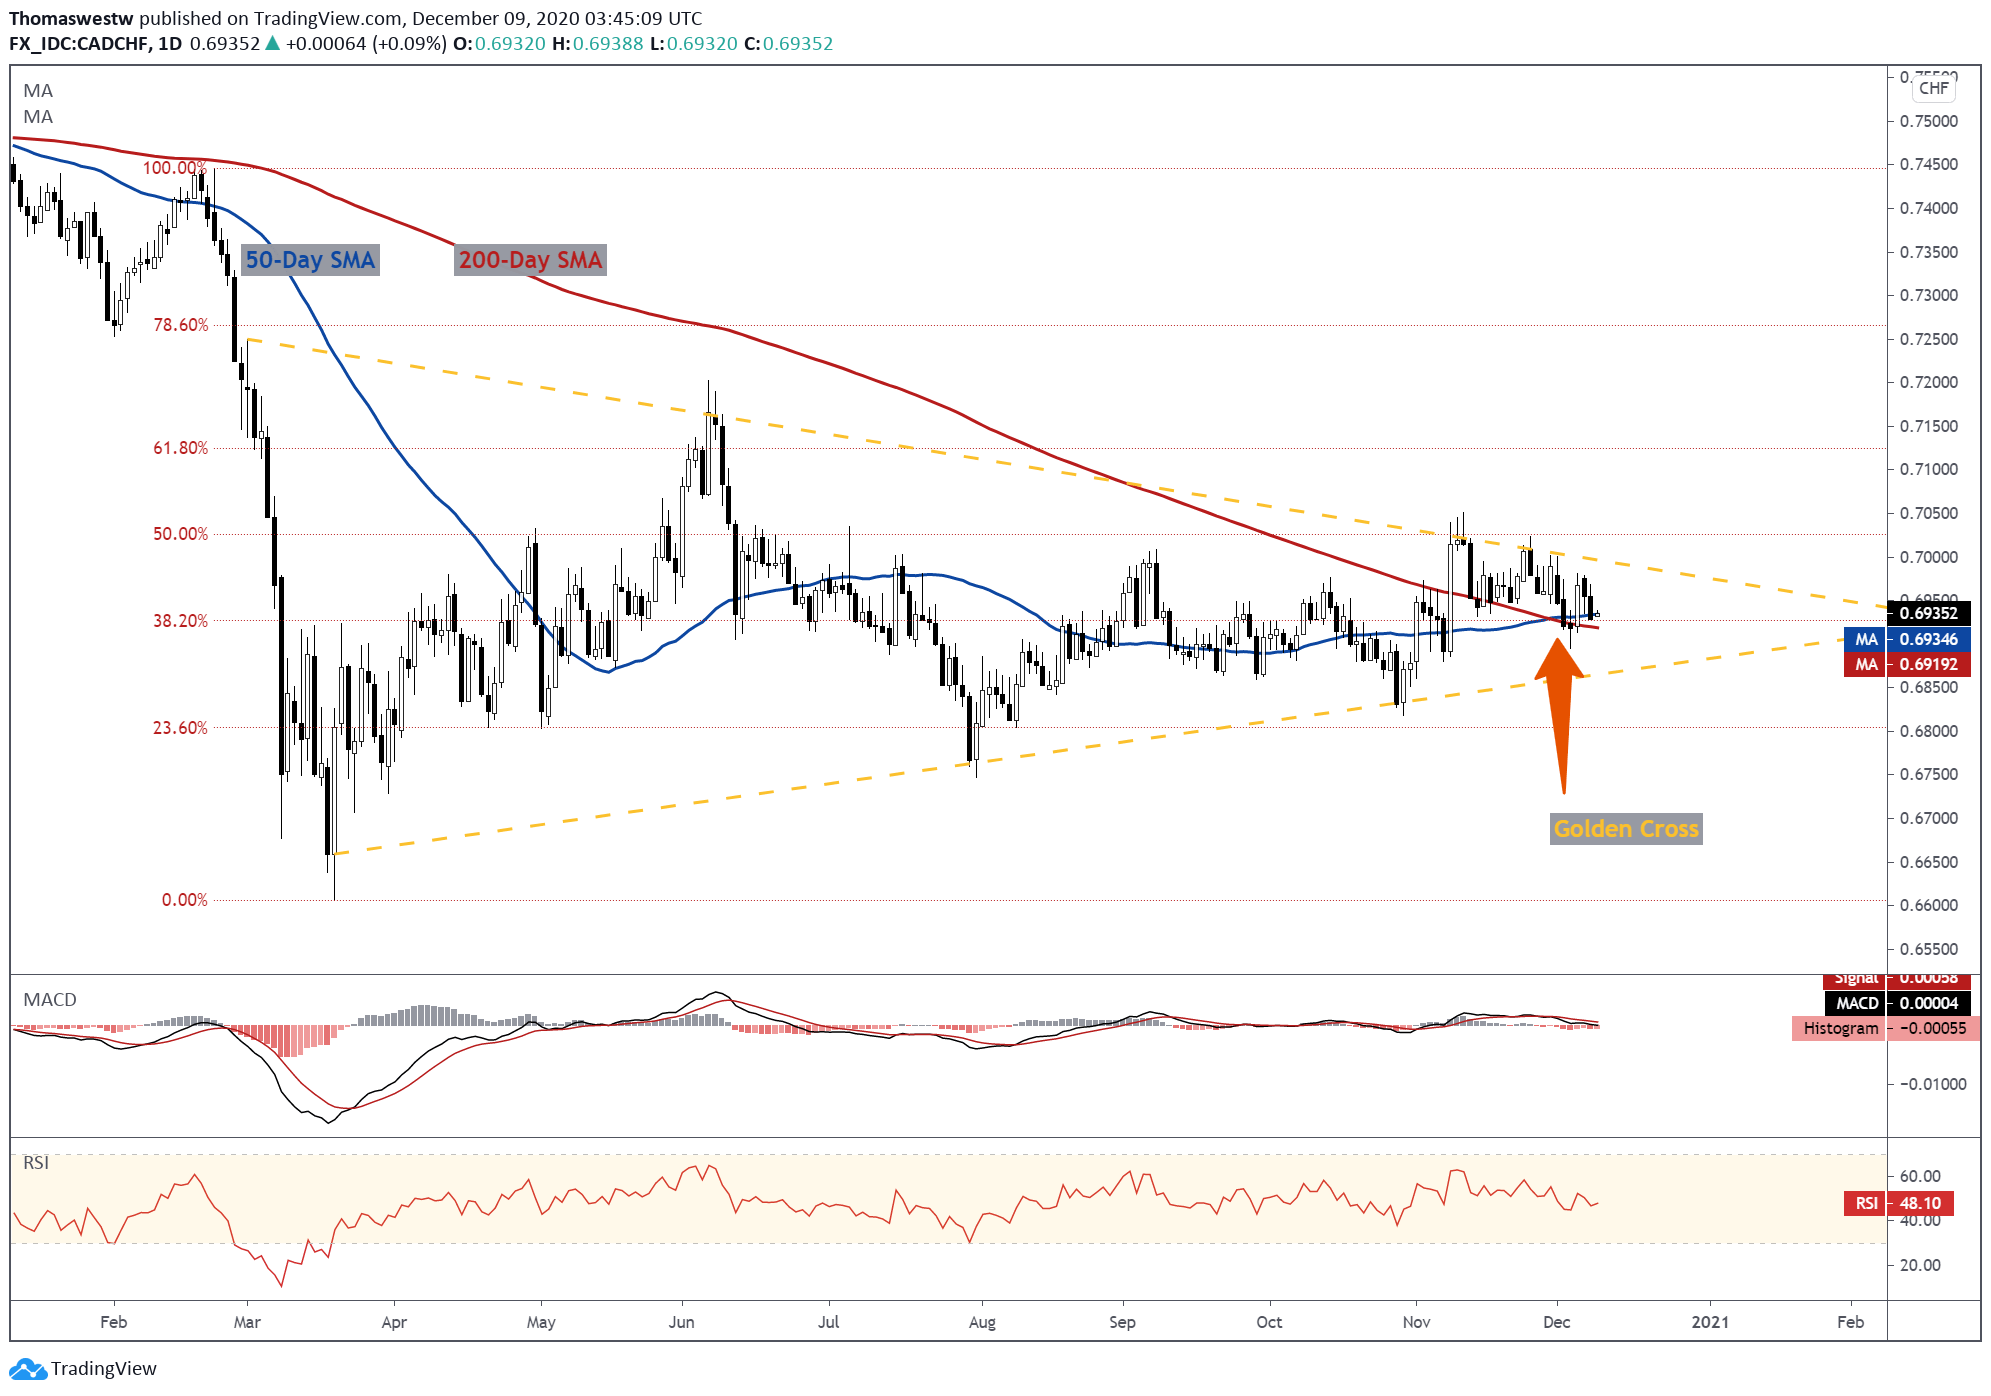
Chart created with TradingView
NZD/CHF Technical Analysis
The Swiss Franc’s technical posture has fared worse against the New Zealand Dollar since NZD/CHF’s March low. Currently, prices are pulling back after rising to its highest level since January. Further movement to the downside appears possible with the current MACD signal line accelerating towards the zero barrier.
However, NZD/CHF’s RSI moderated Tuesday and the 50-day SMA shows the longer-term trend continues to favor upside momentum. The former July high (0.6226) directly below may stifle shorter-term movements if it acts as new support. For now, NZD/CHF may consolidate near current levels before bulls stage another rally.
NZD/CHF Daily Chart
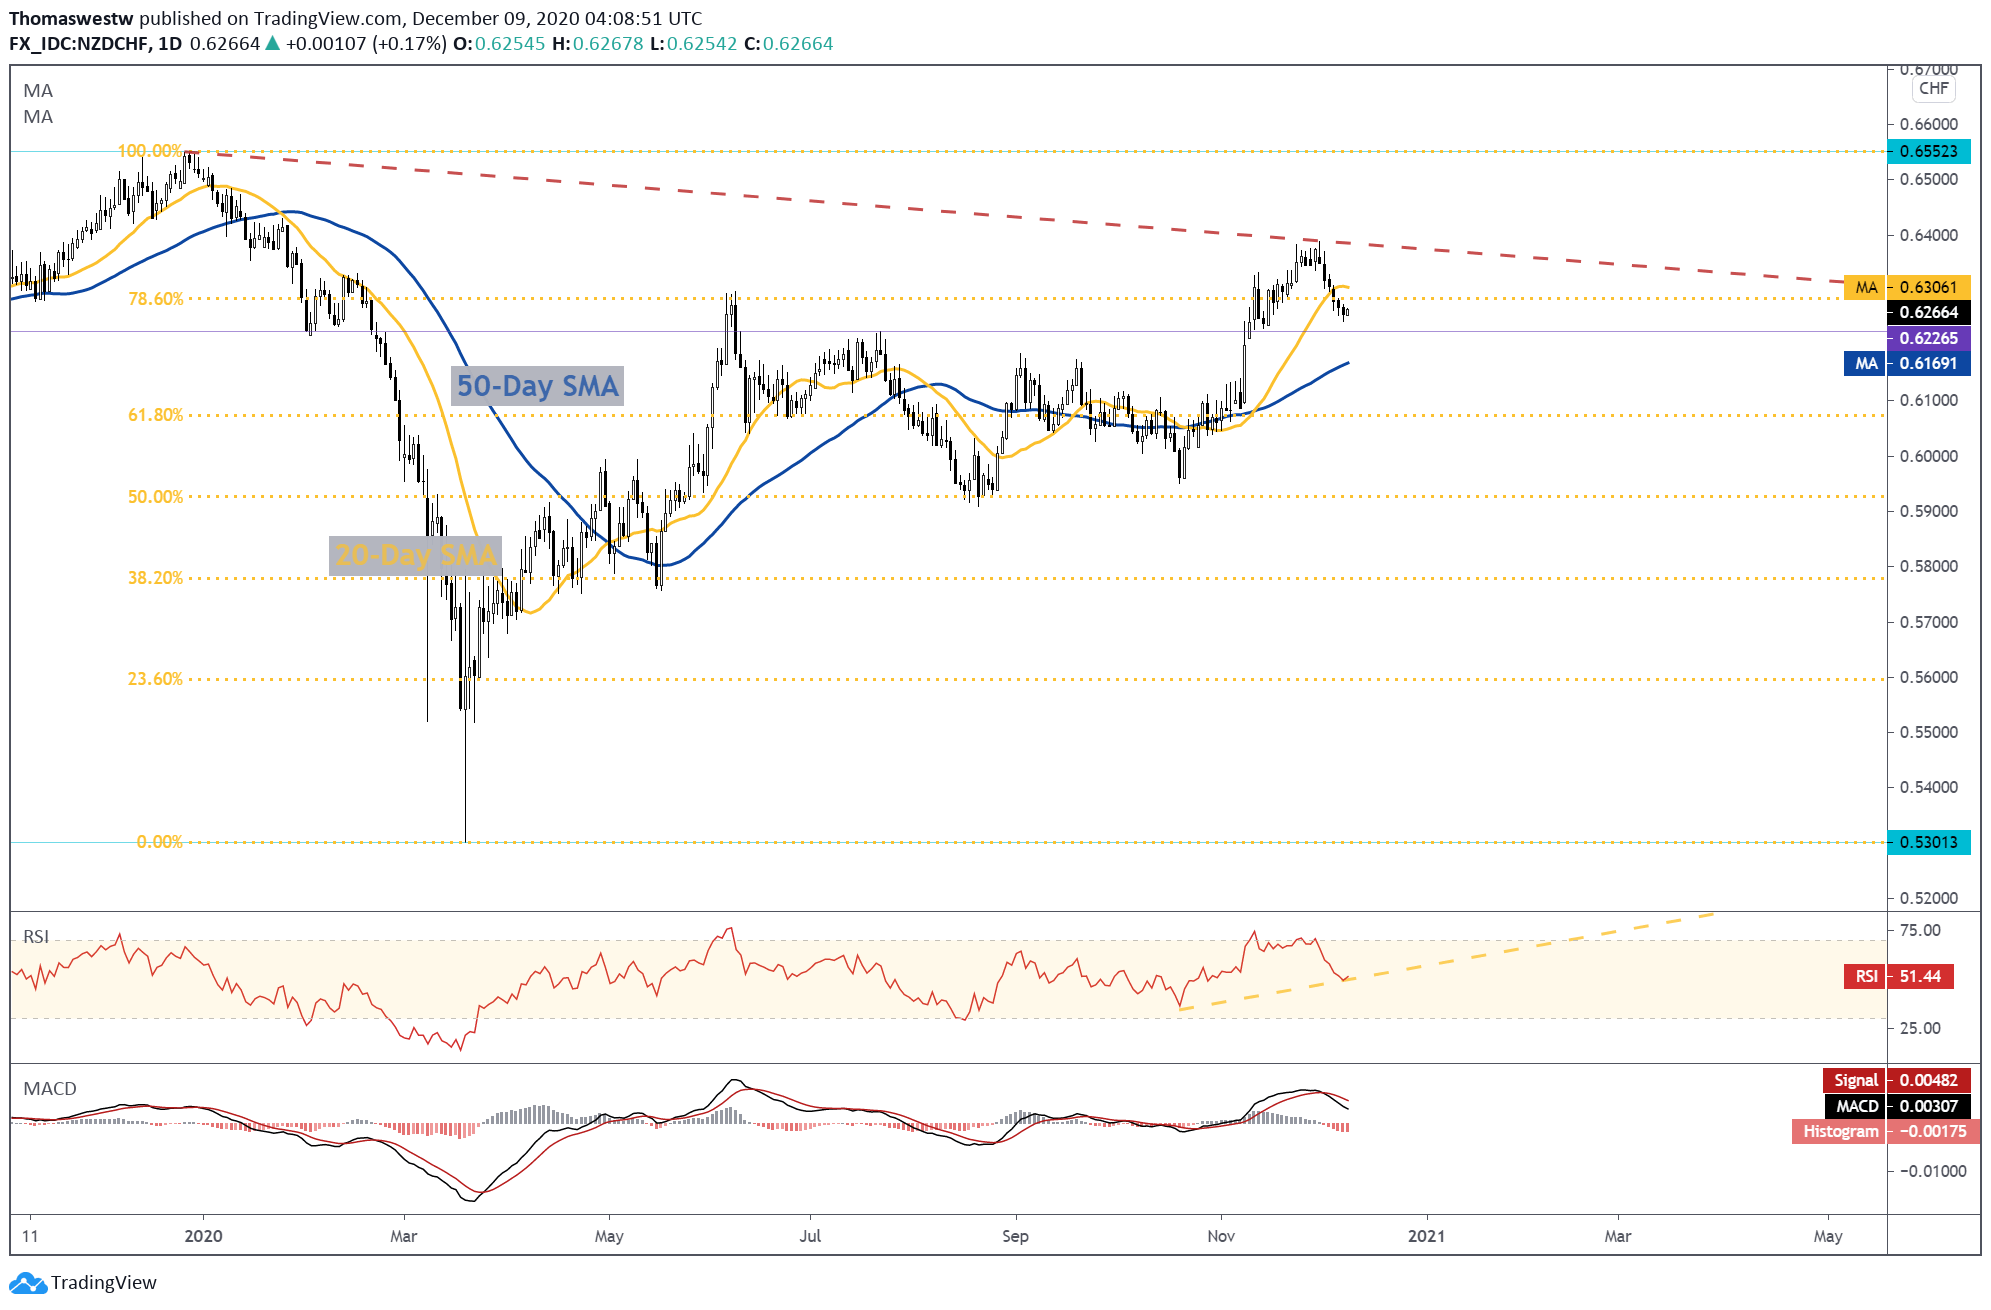
Chart created with TradingView
CHF/JPY TRADING RESOURCES
- Just getting started? See our beginners’ guide for FX traders
- What is your trading personality? Take our quiz to find out
- Join a free webinar and have your trading questions answered
--- Written by Thomas Westwater, Analyst for DailyFX.com
To contact Thomas, use the comments section below or @FxWestwater on Twitter


