


S&P 500 Price Outlook: Options Traders Hedge, Retail Increases Bullish Bets as VIX Index Surges
- Equity options traders shift to a protective stance as market volatility explodes
- IG Client Sentiment shows a bullish turn in S&P 500 retail trader positioning
- France enters second nationwide lockdown as new COVID-19 cases spike
The S&P 500, along with the broader US equity group, closed deep in the red on Wednesday as markets grappled with the threat of rising coronavirus infection rates and mounting uncertainty headed into the November 2020 election. A sharp jump in volatility accompanied recent price action, with the VIX index climbing above the 40 handle, which is the highest reading since June. The rise in market volatility given the proximity to the election is in line with historical norms, but concerning for traders nonetheless.
S&P 500 and VIX Index (Daily Price Chart)
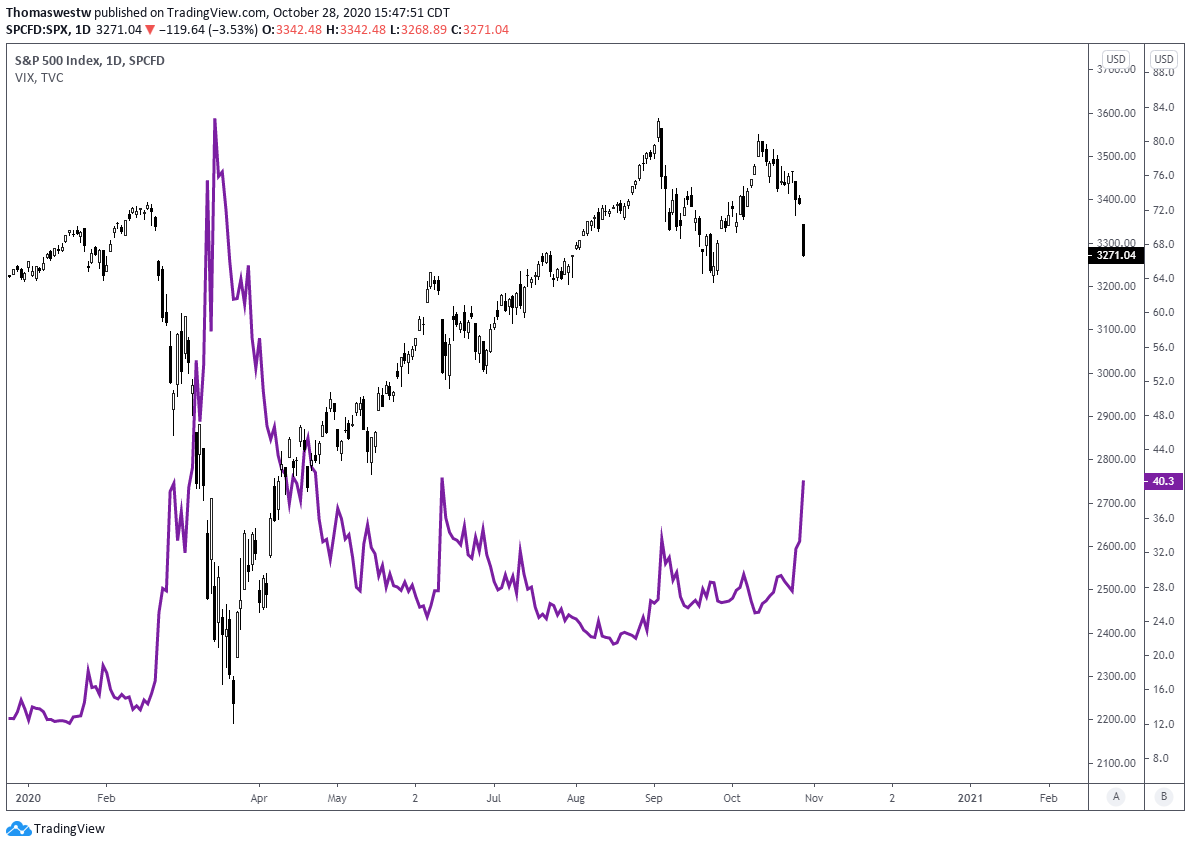
Chart created with TradingView
The rise in volatility with the election now only 6 days away may not be outside of historical norms, but the election backdrop is materially different given the current pandemic. New virus cases are rising at an alarming rate in the United States. The US reported 73,096 new cases for Tuesday, a 6.1% rise over the past 7 days, according to The COVID Tracking Project.
US COVID Trends

Source: The COVID Tracking Project
Europe’s daily cases are also accelerating at an alarming pace. In fact, France just announced a second nation-wide lockdown Wednesday afternoon. French President Macron said, “The virus is spreading throughout France at a pace which even the most pessimistic forecasts did not anticipate.” France has seen nearly 1,700 deaths over the last week according to ECDC data.
Examining options traders’ positioning via Cboe’s Put/Call Ratio, which compares the amount of put options traded relative to call options, reveals a reading of 1.148. This is the highest read since early May. A value above 1.0 indicates equity index options trader positioning is skewed more heavily toward put options relative to call options, which suggests a bearish bias.
S&P 500 Index VS CBOE SPX Total Put/Call Ratio (Daily Time Frame)
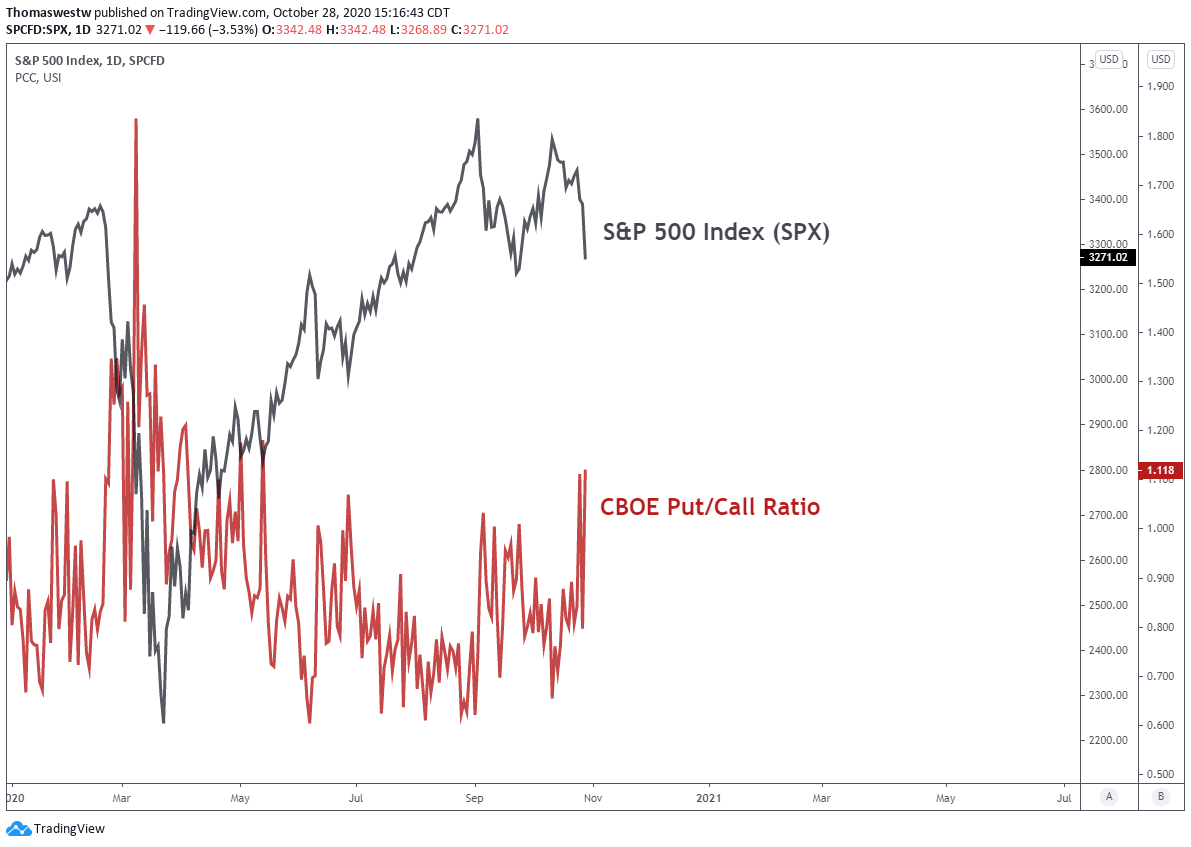
Chart Created with TradingView
Looking IG Client Sentiment data, can analyze S&P 500 trader positioning through the lens of retail CFD traders. The most recent IGCS report shows the ratio of traders short to long at 1.17 to 1. The amount of traders net-long increased 12% from yesterday, and traders net-short decreased 12 percent over the same timeframe. Unlike options traders, who tend to follow price trends, retail CFD traders appear to be increasing their bullish bets on the S&P 500. The recent movement suggests a bearish signal as we normally take a contrarian view on retail positioning.
| Change in | Longs | Shorts | OI |
| Daily | -7% | 2% | -2% |
| Weekly | -10% | 1% | -4% |


