


EUR/USD Outlook:
Visit the DailyFX Educational Center to learn about psychological levels and more
Bulls Eyeing 1.200
From a technical perspective, price action is nearing the psychological level of 1.200 and is lurking around the 50% Fibonacci retracement of the historical move.
Meanwhile, Germany, the largest economy in Europe, appears to be recovering at a pace that has surpassed economists’ expectations. Comments early from German Federal Minister of Economics Peter Altmaier suggested that the German economy would rebound quicker than previously thought with 2020 GDP now seen at -5.8% compared to earlier estimations of -6.3%.
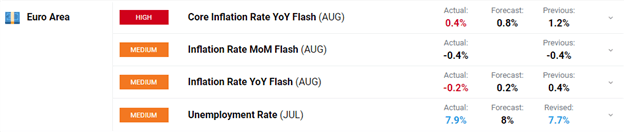
Euro area inflation today failed to meet expectations and leaves the ECB with an ongoing headache. The core rate fell to 0.4% in August compared to expectations of 0.8% and a July figure of 1.2%.
The EUR/USD monthly chart highlights the Fibonacci Retracement plotted between the September 2000 low and the March 2008 high. These two levels are significant as they represent the historical high and low which have yet to be violated. From a visual perspective, the chart demonstrates multiple instances of when these levels provided areas of confluency, providing support and resistance for price action. Currently, price action has favored the bulls, looking for a break above the psychological level of 1.200.
EUR/USD Monthly Chart
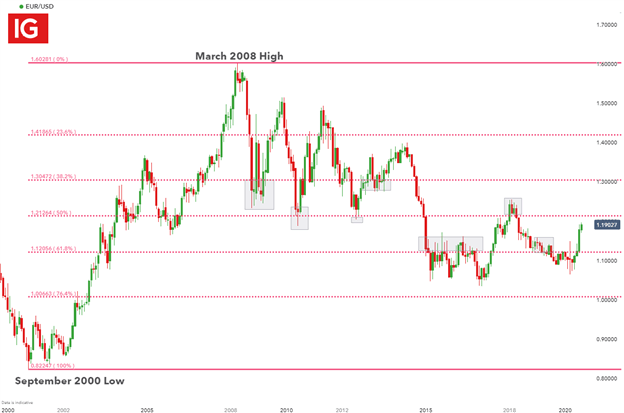
Chart prepared by Tammy Da Costa, IG
EUR/USD Daily Chart
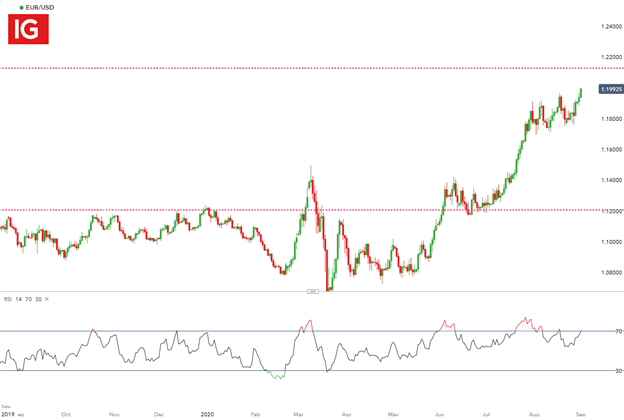
Chart prepared by Tammy Da Costa, IG
Currently, the 61.8% retracement level continues to hold strong at a level of 1.18244. In addition to this, the Relative Strength Index (RSI), is hovering around 70, a possible indication that the pair may be approaching overbought territory as the pair hovers around 70 0n the short-term chart.


