


US Dollar (DXY) Price, News and Analysis:
- Important data releases and the Jackson Hole Symposium on the docket.
- $148 billion auctions of 2-, 5- and 7-year USTs this week.

The daily US dollar (DXY) is currently treading water ahead of a slew of important data releases and speeches from Fed chair Jerome Powell this week. In addition, the US Treasury market is likely to come under pressure as dealers and investors ready themselves for $148 billion of short-term US Treasury issuance that may well press yields higher.
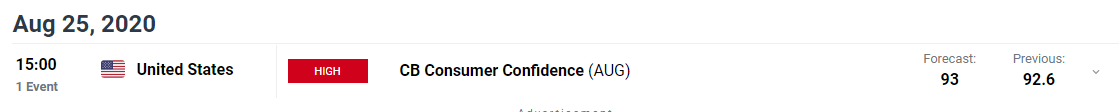
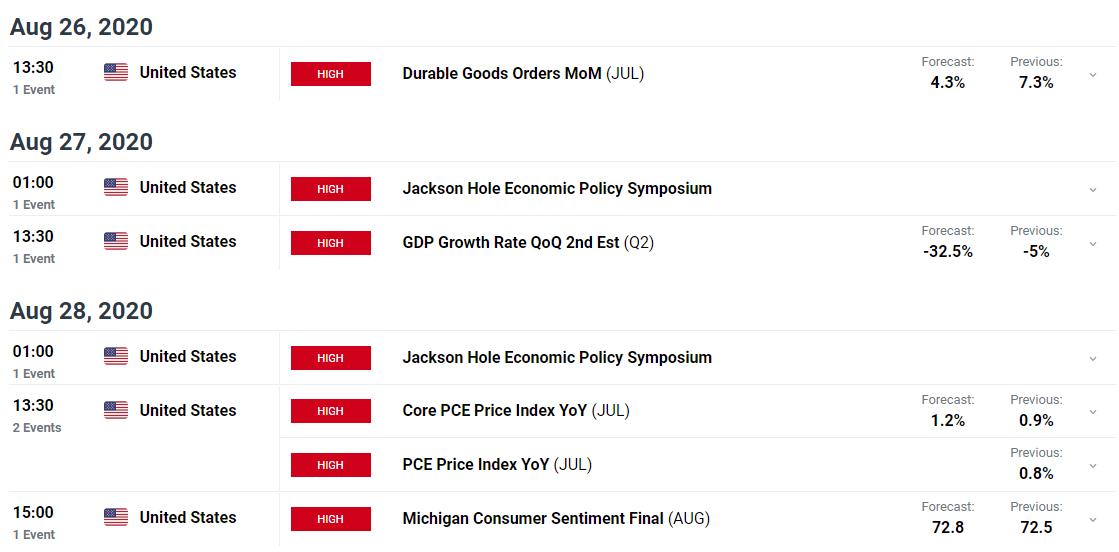
This week’s economic calendar reveals a handful of important US economic releases, all of which can make or break a move. News events are important for forex fundamental analysis and interpreting data is key when looking for hints about future moves. While hard data is important, this week the annual Jackson Hole Symposium starts on Thursday with an eagerly-awaited speech by Fed chair Jerome Powell opening the two-day virtual conference. A lot will depend on Powell’s speech after last week’s Fed minutes showed employment slowing down while economic uncertainties remain. If chair Powell doubles down on this negative backdrop, then further stimulus will be priced-in, pushing the even US dollar lower.
Today’s consumer confidence release for August, needs to be closely watched, while Wednesday’s durable goods, Thursday’s second look at US Q2 GDP and Friday’s core PCE and Michigan consumer sentiment are all capable of ramping up volatility.

US Treasury yields are starting to creep higher today as dealers, and investors, make room for a short $150 billion of 2-, 5- and 7-year US Treasuries issuance starting today. Markets normally try and force prices lower/yields higher ahead of new UST issuance to get a better level to buy the new stock.
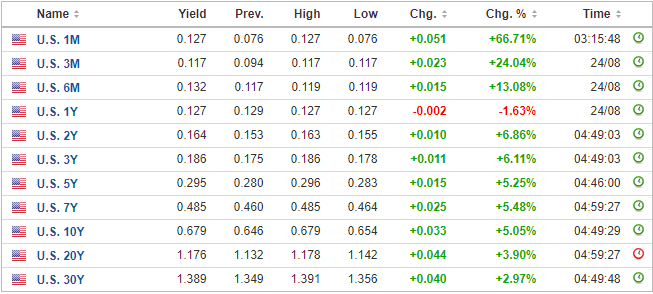
While higher UST yields should buttress the dollar, it remains to be seen if this is just short-term support or the start of a medium-term move higher for the greenback.
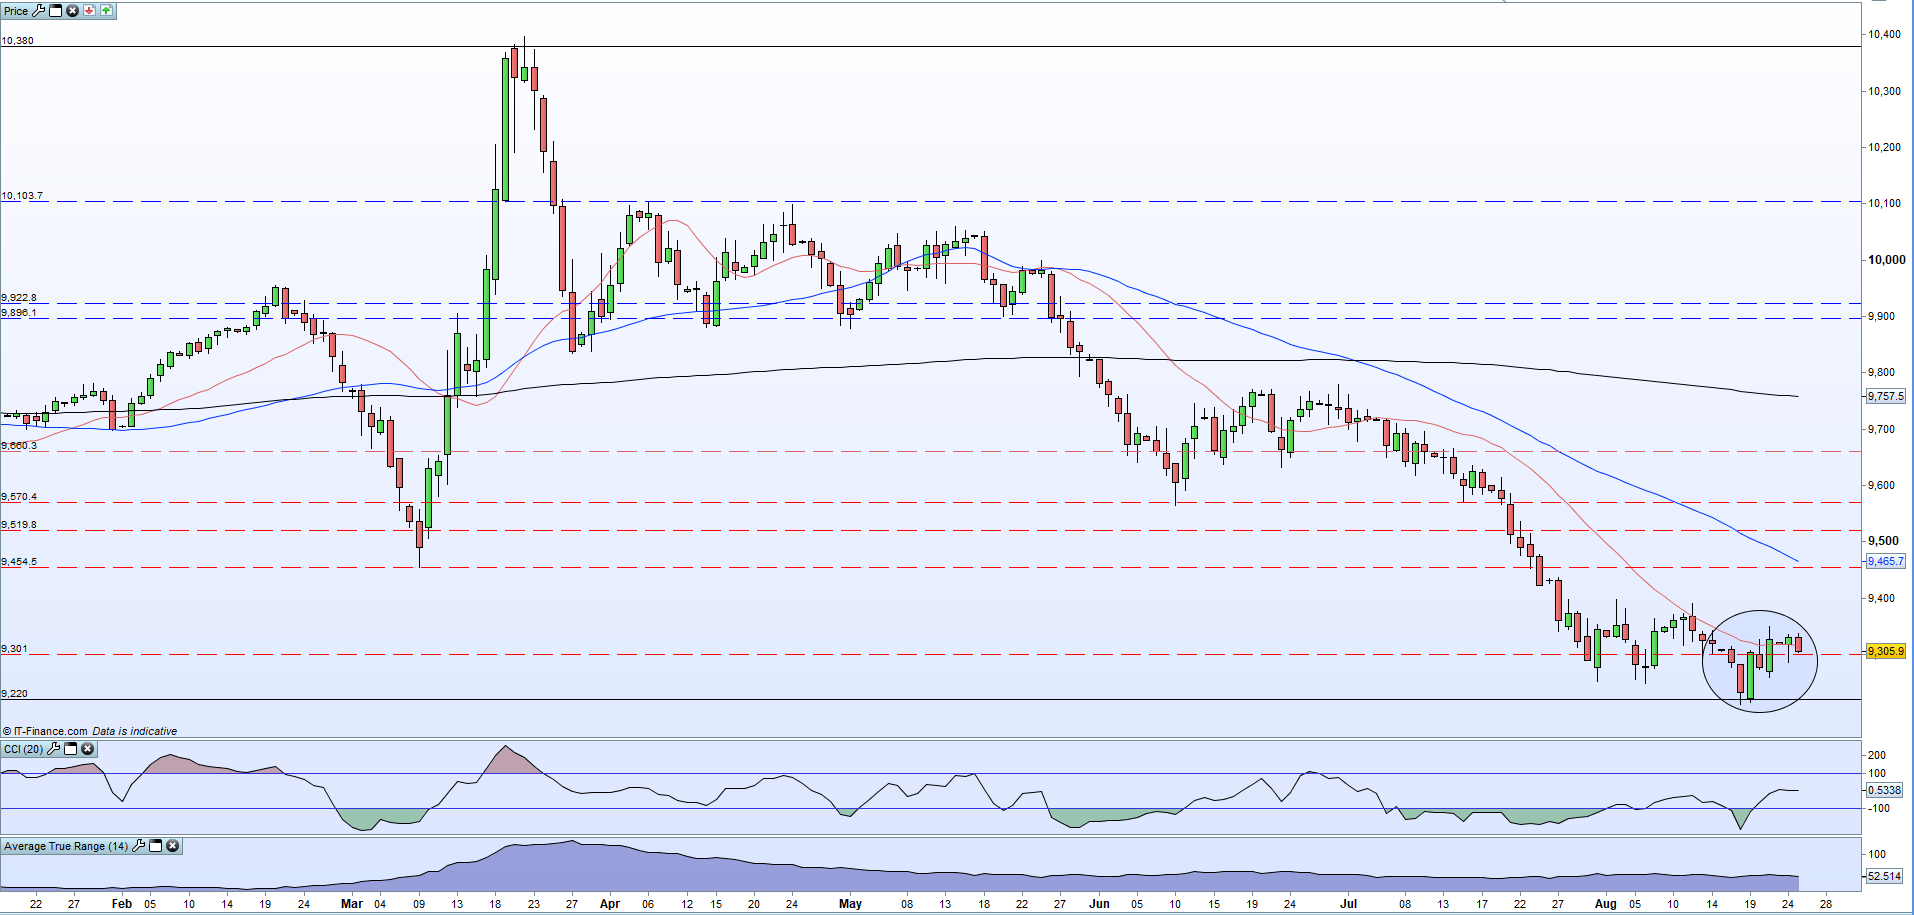
The daily DXY chart shows a couple of bullish technical signals that may suggest higher prices in the short-term. Last Friday a bullish engulfing candlestick was formed, just two days after another near-bullish candlestick. In addition, higher lows can be seen in five out of the last six days - excluding the Sunday print – and the DXY is also battling with resistance off the 20-day moving average. If the DXY can open above the 20-dma, then the 93.50-94.00 zone comes into play, while any further rejection of the 20-dma sees the 92.10-92.50 zone back in focus. It may be wise to let this week’s events play out before looking at the next move in the US dollar.
If you would like to learn more about candlestick patterns and formations, we have prepared a primer on the Top 10 Candlestick Patterns to Trade the Markets
US Dollar Basket (DXY) Daily Price Chart (January – August 25, 2020)
What is your view on the US Dollar – bullish or bearish?? You can let us know via the form at the end of this piece or you can contact the author via Twitter @nickcawley1.


