


GBP/USD and GBP/NZD Prices, Charts and Analysis:
For all economic data releases and market moving events, see the DailyFX Economic Calendar
The latest FOMC minutes saw a subtle shift in guidance from the Federal Reserve with further forward guidance seemingly being pushed further down the line. Fed officials warned that economic growth was ’less robust than in the previous forecast’ and that the jobs market remained weak as the ongoing spread of COVID-19 continues to weigh on the economy. The committee also pushed back on talk of yield curve control, allowing the US dollar room to pick-up from a 2 year+ low.

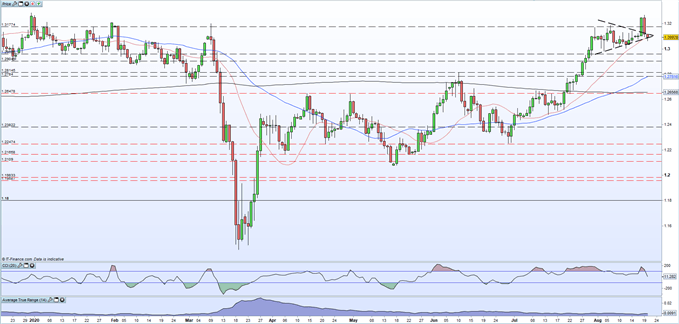
GBP/USD volatility picked up sharply yesterday, trading in 180 pip range, double the 14-day average true range, and the pair are now testing trend support at the apex of a bullish pennant. This pennant was broken convincingly on Tuesday, allowing GBP/USD to make a fresh multi-month high, and this technical formation will need to be watched closely over the short-term. Support remains around the 1.3000 area.
Pennant Patterns – Trading Bullish and Bearish Pennants
GBP/USD Daily Price Chart (January – August 20, 2020)
| Change in | Longs | Shorts | OI |
| Daily | 3% | -7% | -3% |
| Weekly | 4% | -10% | -5% |
The recent ten big-figure rally in GBP/NZD came to a halt Wednesday as the Kiwi dollar picked up a bid against a range of currencies. Recent price action has been centered around the 200-day moving average, and this longer-term technical indicator – currently at 1.9990 – will need to broken convincingly to the upside to let the recent rally continue. A cluster of old lows, and the 20-dma, all the way down to 1.9750 should slow any further sell-off.
GBP/NZD Daily Price Chart (January – August 20, 2020)

Traders of all levels and abilities will find something to help them make more informed decisions in the new and improved DailyFX Trading Education Centre
What is your view on Sterling – bullish or bearish?? You can let us know via the form at the end of this piece or you can contact the author via Twitter @nickcawley1.


