


EUR/USD Outlook:
- Bulls remain restricted by key Fibonacci levels
- EUR/USD under pressure amid US retail Sales data
- Relative Strength Index (RSI) approaches overbought territory
Price Action Hovers Around Key Area of Resistance
After a swift recovery from the March 2020 low, EUR/USD price action has been in favor of the bulls, at least up until last week. With both NFP and inflationary data exceeding expectations, the USD managed to strengthen slightly against its major counterpart, creating a wall of resistance for the pair.
Visit the DailyFX Educational Center to discover why news events are
Key to Forex Fundamental Analysis
With price action temporarily stalled, focus has now turned to the high-impact economic data expected to be released later today. US Retail Sales (released at 12.30 GMT), is of particular importance as better than expected results may be an additional catalyst for surging treasury yields.

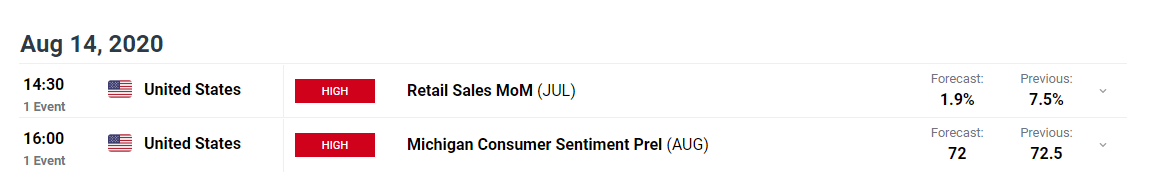
For all market-moving data releases and events see the DailyFX Economic Calendar
RSI Boarders Overbought Territory
From a technical perspective, the weekly chart below highlights the Fibonacci retracement (blue) plotted between the February 2018 high to the March 2020 low.
EUR/USD Weekly Chart

Chart prepared by Tammy Da Costa, IG
For the past 4 months, a strong upward trend has been present, until reaching an area of confluency formed by the key Fibonacci levels, providing support and resistance for the pair. As bulls battle to surpass this level, the RSI is bordering around 70, suggesting that the pair may be entering into overbought territory.
Psychological Level Provides Possible Inflection Points
From a shorter-term perspective, the hourly chart below, highlights inflection points around the psychological level of 1.18 has provided an additional level of support and resistance, with multiple inflection points occurring at this level. While Fibonacci levels hold strong, this may be an additional area of importance.
EUR/USD Hourly Chart
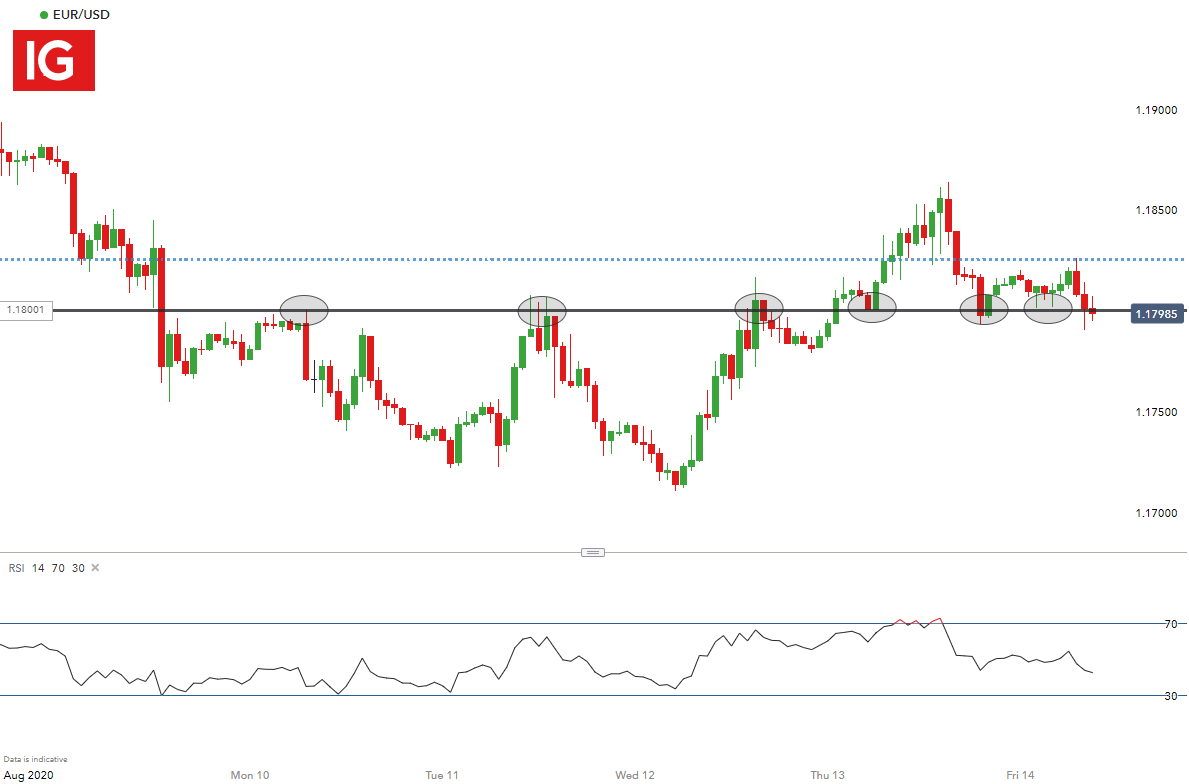
Chart prepared by Tammy Da Costa, IG
Moving Ahead
Should Retail Sales surpass expectations, a potential break towards the downside may see prices falling towards 1.1593, the 50% Fibonacci level.
On the contrary, a continuation of an upward trend, may push prices higher towards the psychological level of 1.2.
Client Sentiment
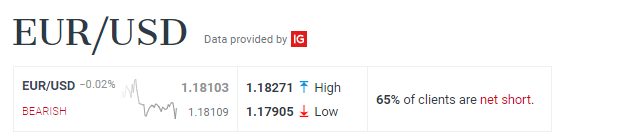

IGCS shows that, at the time of writing, 65% of retail traders are holding short positions in the EUR/USD. We typically take a contrarian view to crowd sentiment, however, in anticipation of retail sales data, prices may continue to fall.
--- Written by Tammy Da Costa, Market Writer for DailyFX.com
Contact and follow Tammy on Twitter: @Tams707


