


S&P 500 INDEX PRICE OUTLOOK: VIX ‘FEAR-GAUGE’ BUOYED BY DEMAND FOR DOWNSIDE PROTECTION AMID CORONAVIRUS STIMULUS STALEMATE
- S&P 500 price action attempts to gravitate higher as big tech leads the way
- VIX Index ‘fear-gauge’ remains perky amid ongoing coronavirus stimulus talks
- Stocks look at risk of heading lower if congress fails to break the impasse
The S&P 500 is set to close out a widely uneventful yet choppy trading session slightly higher on the day. Other major US stock market benchmarks like the Dow Jones and Nasdaq reflect similarly green but overall muted changes in performance. With high-profile earnings releases from some of the biggest companies by market cap in the rearview mirror, investors seem to have shifted focus to another overarching fundamental driver of equities: fiscal stimulus.
| Change in | Longs | Shorts | OI |
| Daily | 1% | -1% | 0% |
| Weekly | 15% | -13% | -1% |
According to the latest stimulus headlines, US Treasury Secretary Steven Mnuchin stated that congress is no closer to reaching a deal on another round of coronavirus stimulus than they were last week. This follows politicians letting the extra $600 monthly unemployment insurance benefit provided in the wake of COVID-19 expire this past weekend. That said, Mnuchin just flirted the idea that President Trump and his administration are drafting potential executive actions if congress fails to break the impasse, which appeared to help bolster stocks off intraday lows.
S&P 500 PRICE CHART WITH VIX INDEX OVERLAID: DAILY TIME FRAME (DEC 2019 TO AUG 2020)
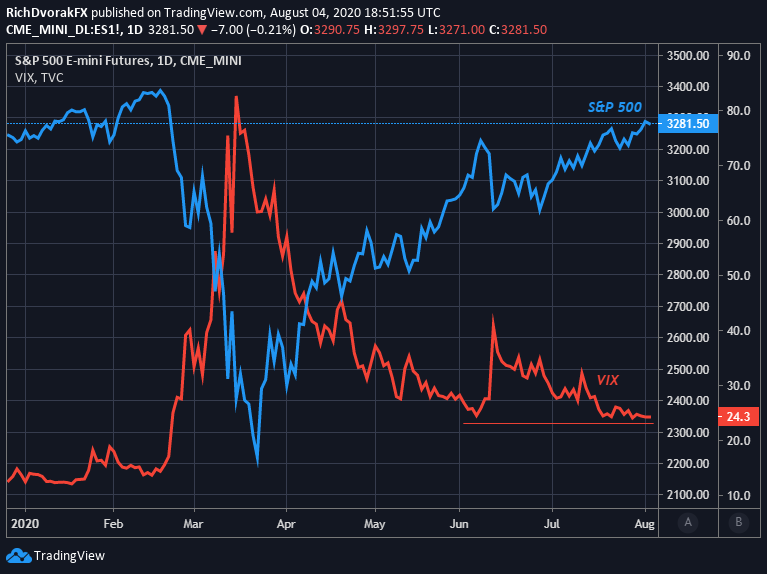
Chart created by @RichDvorakFX with TradingView
S&P 500 price action this afternoon helped highlight how investors are largely fiending for more fiscal support to reinvigorate the stock market rally off of March’s trough. Meanwhile, the VIX Index, or fear-gauge, hints at lingering skepticism towards the S&P 500 trading positive year-to-date and about 3% below its record high. The S&P 500 VIX Index typically rises during periods of uncertainty and risk aversion as investors seek to hedge against potential downside in stocks.

On that note, the S&P 500 could be on the cusp of a larger reversal and may soon face a day of reckoning in light of the current fiscal stimulus stalemate. This bearish scenario might warrant additional credence the longer politicians drag their feet and Americans struggle to pay their bills. Not to mention, weekly jobless claims data has climbed higher for the past three weeks in a row and shows 17-million Americans continuing to file for unemployment insurance. Furthermore, the monthly nonfarm payrolls report for July is slated to cross the wires this coming Friday at 12:30 GMT, which could weigh considerably on appetite for risk and thus S&P 500 price action.
-- Written by Rich Dvorak, Analyst for DailyFX.com
Connect with @RichDvorakFX on Twitter for real-time market insight


