


STOCK MARKET OUTLOOK: S&P 500 INDEX, NASDAQ PRICE EDGE LOWER AS RISING JOBLESS CLAIMS PUTS PRESSURE ON STOCKS
- S&P 500 dropped over 1% and the Nasdaq spiked more than 2.5% lower on Thursday
- Stock market sentiment shows signs of weakening in response to jobless claims data
- Markit PMI reports on tap for Friday’s trading session might steer stocks going forward
Stocks came under pressure on Thursday and finished the trading session near intraday lows. Investors tapped the breaks on the risk rally as market sentiment seemingly waned in response to disappointing weekly jobless claims released prior to the New York opening bell. The S&P 500 slid 1.2% while the Nasdaq spiked 2.7% lower gauged by e-mini futures prices.

S&P 500 PRICE CHART WITH NASDAQ OVERLAID: 5-MINUTE TIME FRAME (23 JUL 2020 INTRADAY)
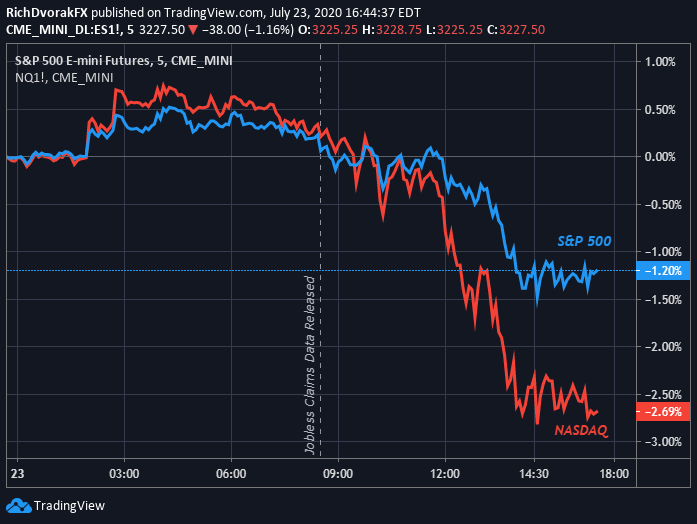
Chart created by @RichDvorakFX with TradingView
The market’s bearish reaction to the latest initial jobless claims data might have caused some investors to raise an eyebrow given the ‘bad news is good news’ environment largely fostered by central bank backstops deployed over recent months. That said, today’s red-colored tape nevertheless provides a healthy reminder that stocks can lose value and do not ‘only go up.’

US INITIAL JOBLESS CLAIMS CHART: WEEKLY TIME FRAME (03 JAN TO 17 JUL 2020)
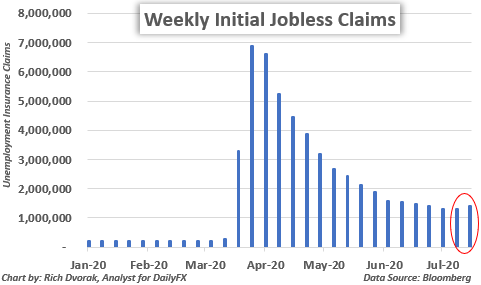
Not only did initial jobless claims data cross the wires at a worse-than-expected 1.4-million for the week ended July 17, the number of Americans filing for unemployment insurance rose sequentially for the first time since March, and could explain in part why investors steered stocks lower. After all, the Fed may be able to print money and provide liquidity, but the central bank cannot print jobs.

Looking ahead to Friday’s trading session we find that another high-impact economic data release looms: preliminary Markit PMI readings. Another disappointing datapoint could suggest that the v-shaped economic recovery may be growing long in the tooth and potentially add to stock market selling pressure witnessed on Thursday in response to jobless claims. On the other hand, sustained improvement in economic activity indicated by upcoming Markit PMI reports likely stands to reinvigorate investor risk appetite, which could send the S&P 500 and Nasdaq snapping back higher.
Keep Reading – USD Price Outlook: US Dollar Nosedives Ahead of Markit PMI Data
-- Written by Rich Dvorak, Analyst for DailyFX.com
Connect with @RichDvorakFX on Twitter for real-time market insight


