


HANG SENG, CHINA A50, MSCI EM INDEX OUTLOOK:
- Hang Seng Index set to open higher alongside US futures
- China A50 Index registered 9% weekly gain, facing major resistance at 15,000
- MSCI Emerging Market Index climbed to a four-month high
Hang Seng Index Outlook:
Hong Kong’s Hang Seng Index (HSI) stock market benchmark had a decent rally last week, breaking out above a key resistance at 25,000. The rally was accompanied by surging trading volume and increased southbound flow via the Hong Kong-Shanghai and Hong Kong-Shenzhen stock connections. Improved sentiment was seen across the Greater China markets, which outperformed regional peers last week. Fundamentally, this is backed by PBoC rate cuts and a string of upbeat manufacturing PMIs released last week.
The number of brokerage account opening applications on the mainland surged 30% last month, according to a few surveys. This suggests that mainland China’s retail investors are getting increasingly engaged with the domestic stock markets. They may hope to see a repeat of the bull market seen in the end of 2014 to early 2015.
Sectoral rotation was seen on Friday, with financial sector slightly underperforming the benchmark while Commerce & Industry sector gained momentum. Technology companies, namely Tencent, Meituan and Semiconductor manufacturing, were still among the best performing stocks this month.
US futures climbed on Monday morning, setting an upbeat tone for the Asia-Pacific trading open. The US Dollar fell and growth-linked Australian and New Zealand Dollars gained, exhibiting a ‘risk-on’ pattern. Currency traders are eyeing the RBA interest rate decision tomorrow, in which the central bank is expected to keep the cash rate at a record low of 0.25%. Equity traders are preparing for the upcoming Q2 US earnings season for a ‘reality check’.
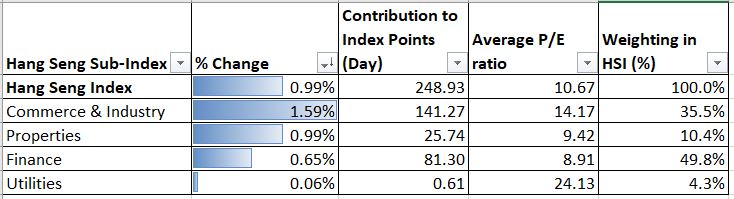
Source: his.com.hk, DailyFX
Hang Seng Index –Technical Analysis
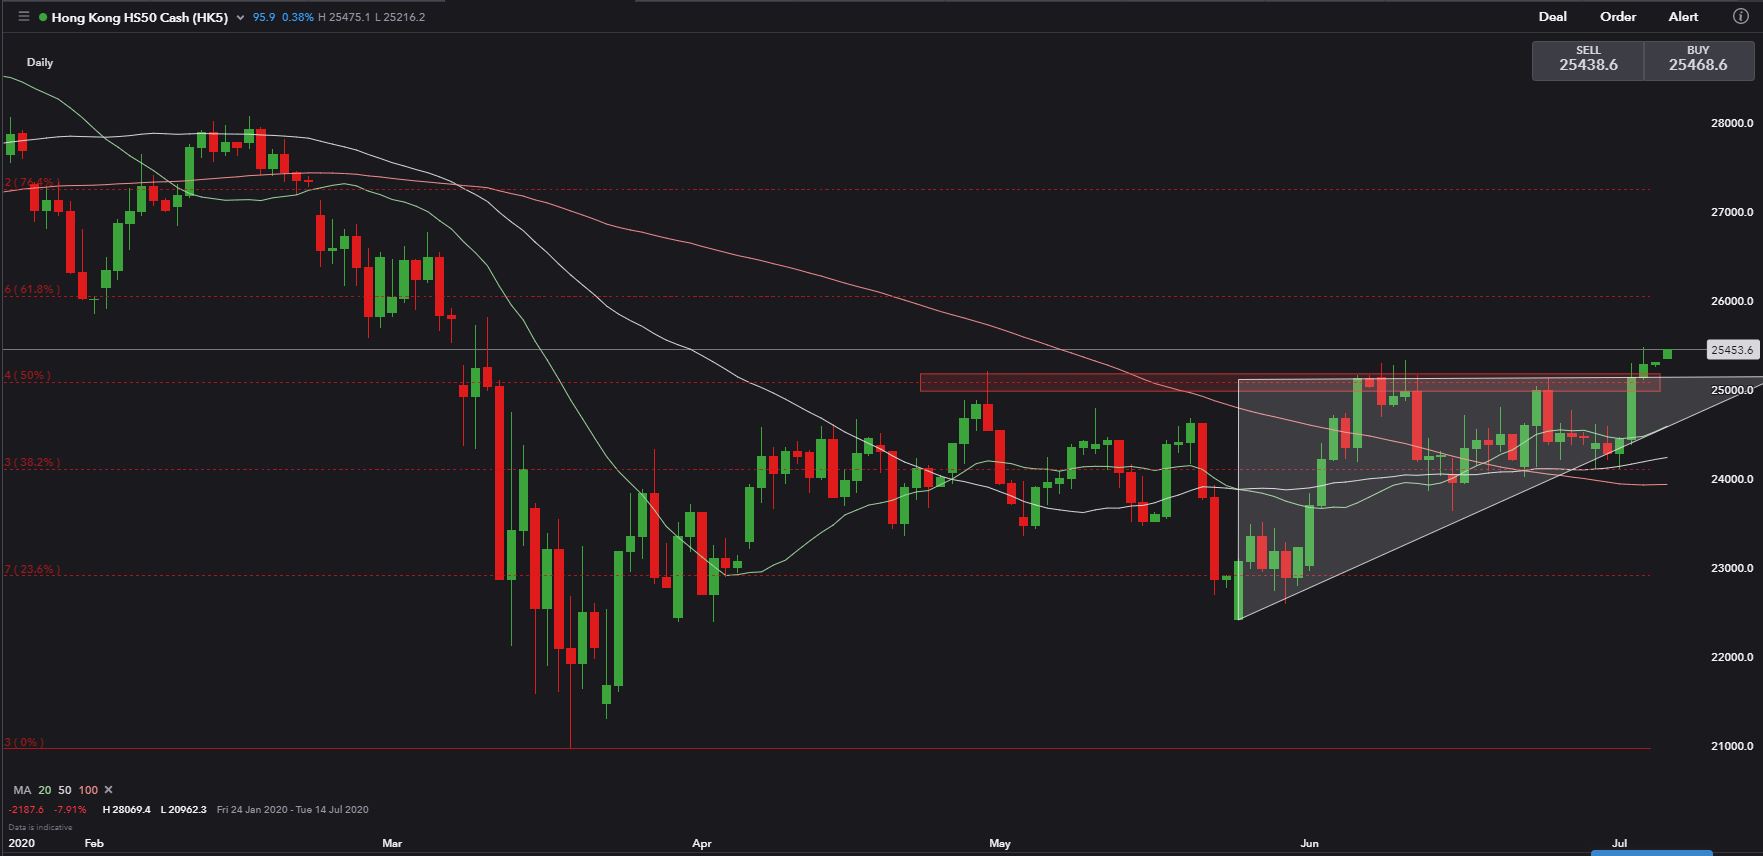
The Hang Seng Index seems to have broken out above a key resistance at 25,000 last week and thus opened room for more upside towards 26,050 – the 61.8% Fibonacci retracement level. It has also broken out of an ‘Ascending Triangle’ that formed since end May.
The MACD indicator has formed a ‘golden cross’, which is a bullish signal. The Directional Movement indicator has firmly entered into expansionary territory, suggesting more upside to come.
Hang Seng Index – Daily Chart
FTSE China A50 Outlook:
The FTSE China A50 index registered a 9% gain last week, making it one of the best performing indices globally. Trading in the Shanghai and Shenzhen stock exchanges continued to heat up, with daily total volume surpassing 1 trillion yuan for two consecutive days. Mainland China brokerage firms were reported to see new account opening requests surging by 30% last month and the trend showed no signs of stopping any time soon. A wealth-creating effect will probably attract more investors to the market, against the backdrop of falling deposit rates and unattractive bond yields.
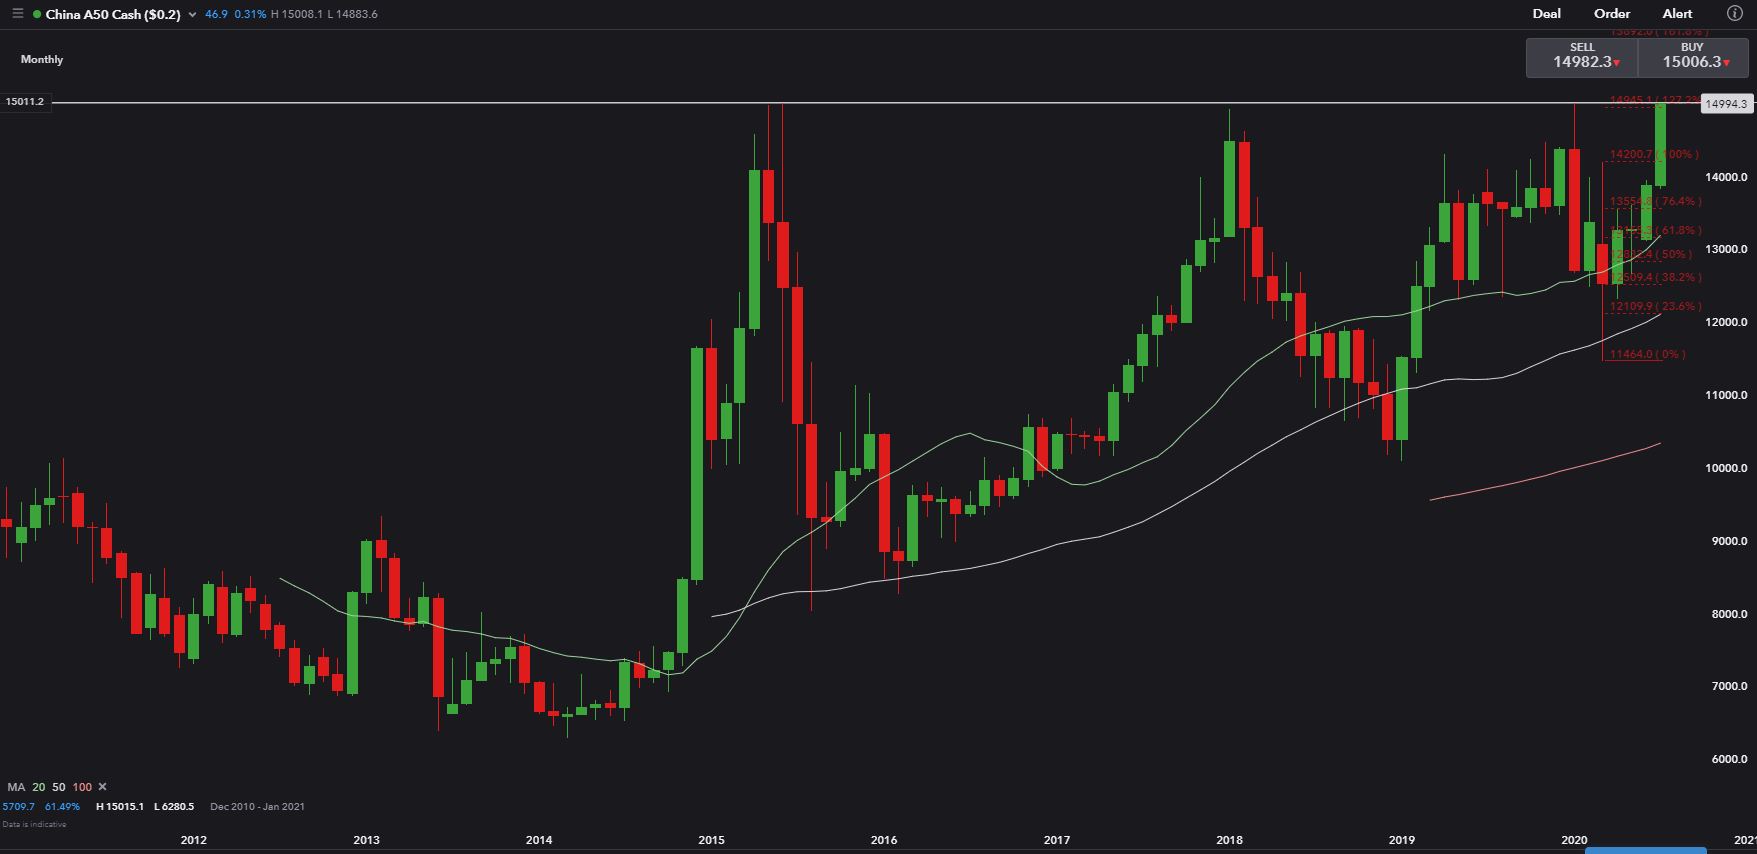
Technically, the China A50 Index is facing a major resistance level at 15,000. Looking into the monthly chart, 15,000 was the highest level it reached in 2015, 2018 and early 2020, and thus it serves as a critical resistance. Its uptrend remains intact as 10-, 20- and 100-Day Simple Moving Averages (SMAs) have formed a ‘golden cross’ and moved higher.
Failing to breach 15,000 will probably lead to a correction towards 14,200.
FTSE China A50 Index – Monthly Chart
MSCI Emerging Market Index:
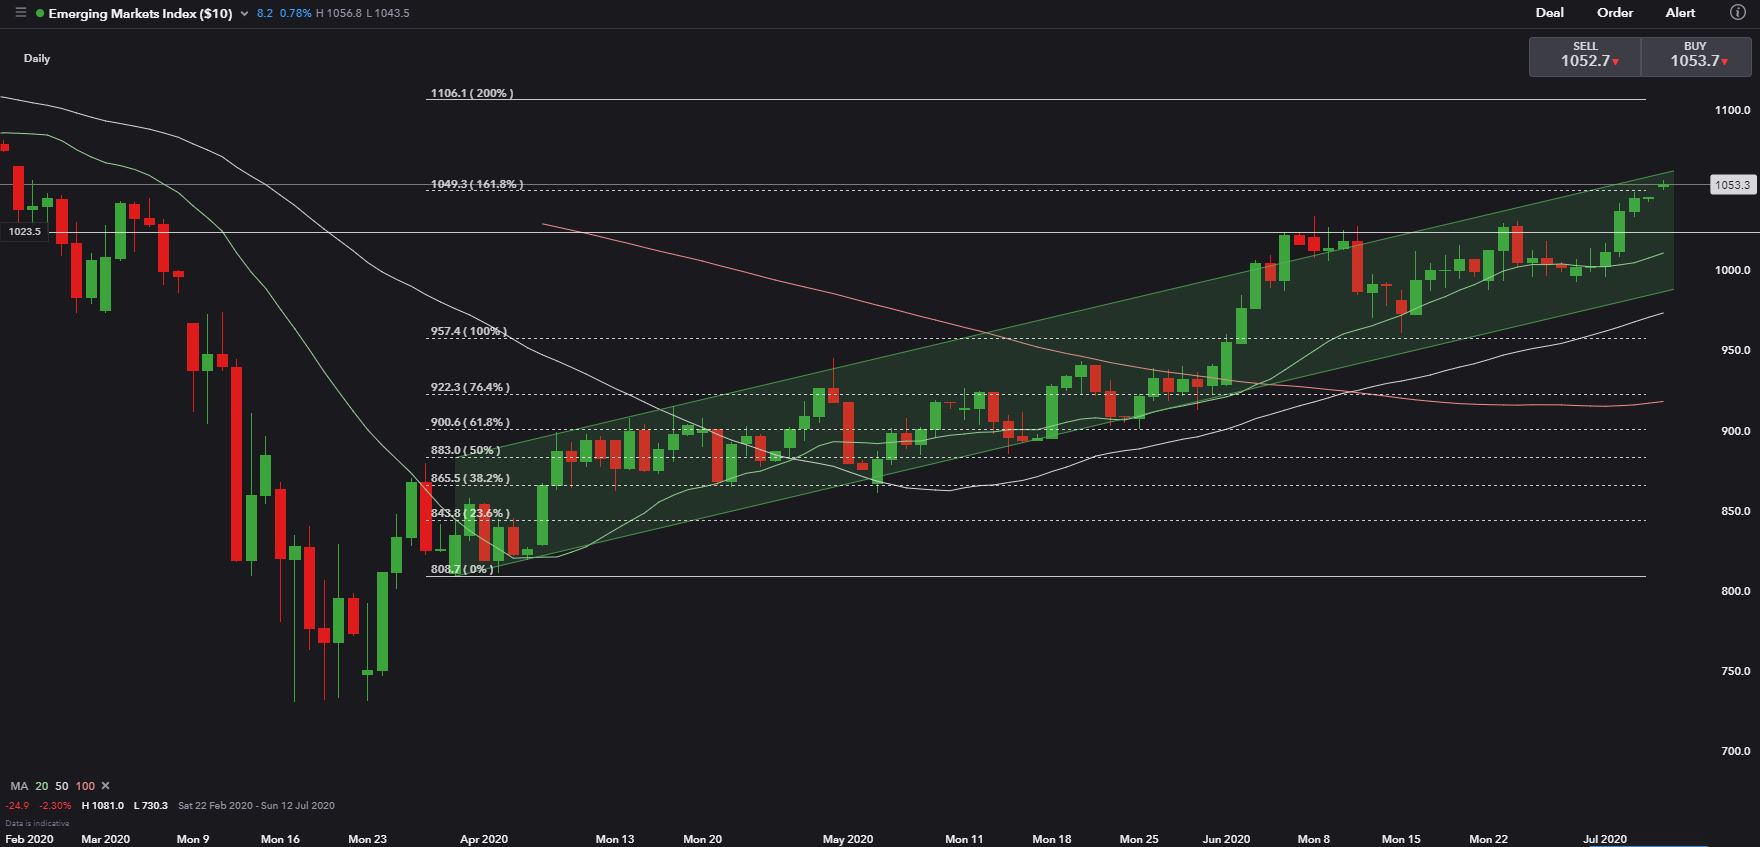
MSCI Emerging Market Index is riding an ascending trend as highlighted in green in the chart below. The index has reached a 161.8% Fibonacci extension level at 1,050, breaking out above which will pave the road for more upside towards 1,106 – the 200% Fibonacci extension.
The MSCI EM index is currently trading at a 17 price-to-earning (P/E) ratio.
MSCI Emerging Market Index – Daily Chart

--- Written by Margaret Yang, Strategist for DailyFX.com
To contact Margaret, use the Comments section below or @margaretyjy on Twitter


