


GBP/USD, EURGBP and FTSE 100 – Prices, Charts and Analysis:
- EU/UK trade talks may weigh on the British Pound is the status-quo remains.
- US-China relations continue to deteriorate leaving risk assets exposed.

A week full of risk events and important data releases will increase market volatility across a range of assets, especially when viewed against a turbulent and fractious political and economic backdrop. Three central bank policy meetings – RBA, BoC and ECB – and US non-farm payrolls will compete for headlines with ongoing US-China headlines and EU-UK trade talks. Risk markets are starting to look fully priced and this could weigh on Sterling and the FTSE 100.
GBP/USD continues to make a short-term pattern of higher lows and higher highs but last week’s run in the pair was primarily due to weakness in the US dollar ahead of month-end portfolio rebalancing. Resistance around the 61.8% Fibonacci retracement at 1.2517 and support likely around 50% Fib retracement at 1.2306. EU-UK trade talk headlines need to be watched closely.
US Dollar Bearish Bets Rise, EUR/USD in Favor – CoT Report
GBP/USD Daily Price Chart (December 2019 – June 1, 2020)

| Change in | Longs | Shorts | OI |
| Daily | 3% | -7% | -3% |
| Weekly | 4% | -10% | -5% |
EUR/GBP is fading lower after the pair broke range resistance in mid-May. Fibonacci retracement numbers also in play with short-term resistance around 38.2% Fib at 0.9035, ahead of 0.9055, and support at 50% Fib 0.8891.
EUR/GBP Daily Price Chart (December 2019 – June 1, 2020)

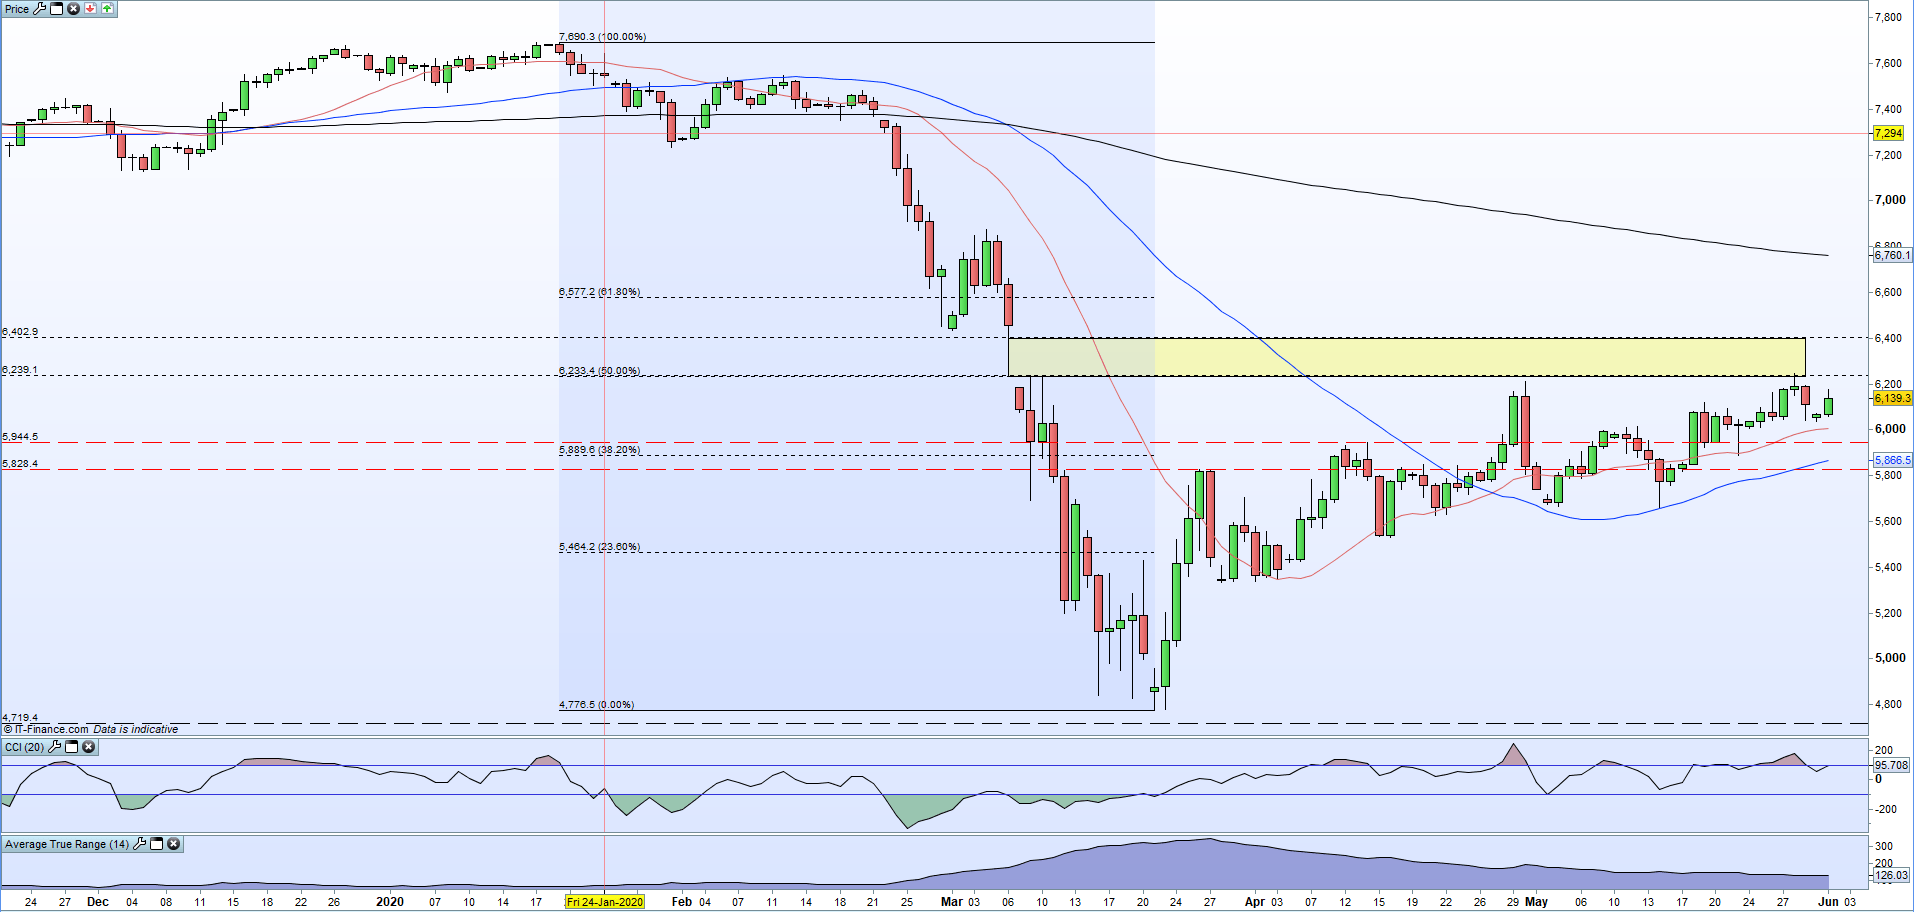
FTSE 100 is facing resistance from another Fibonacci level as well as the bottom of the gap made between March 6 and March 9 between 6,233 and 6,239. A cluster of recent lows between 6,000 and 6,036 and the 20-dma at 6,006 provide the first area of support.
FTSE 100 Daily Price Chart (December 2019 – June 1, 2020)
Traders of all levels and abilities will find something to help them make more informed decisions in the new and improved DailyFX Trading Education Centre
What is your view on Sterling (GBP) – bullish or bearish?? You can let us know via the form at the end of this piece or you can contact the author via Twitter @nickcawley1.


