


Australian Dollar Analysis and Talking Points
- Australian Dollar at Risk: Trade Wars 2.0
- Australian Dollar Tech Levels
Australian Dollar at Risk: Trade Wars 2.0
The Australian Dollar looks set to come into the cross-fires once again as US-China trade tensions pick up. The Trump administration has moved to block shipments of semiconductors to Huawei from global chipmakers, which in turn has seen China look to potentially respond via placing tech companies, such as, Apple and Qualcomm on an unreliable entity list. That said, risks look to be increasing to the downside for high beta currencies, particularly the Australian Dollar. Alongside this, we will be placing a close eye on the offshore Yuan (USDCNH).

Australian Dollar Tech Levels
As downside risks grow for AUD/USD, near term focus is on 0.6400-07, which marks the 76.4% fib retracement. A closing break below opens up room for a test of the May double bottom. On the topside, given the macro backdrop bounces in the Aussie may be short-lived and thus upside to be capped from 0.6450-0.6500.
| Change in | Longs | Shorts | OI |
| Daily | 2% | 3% | 2% |
| Weekly | 29% | -46% | 0% |
Implied Weekly range (0.6320-0.6530)
| Support | Resistance | ||
|---|---|---|---|
| 0.6400 | - | 0.6450 | - |
| 0.6370 | May Double Bottom | 0.6500 | - |
| 0.6350 | - | 0.6515 | 100DMA |
AUD/USD Price Chart: Daily Time Frame
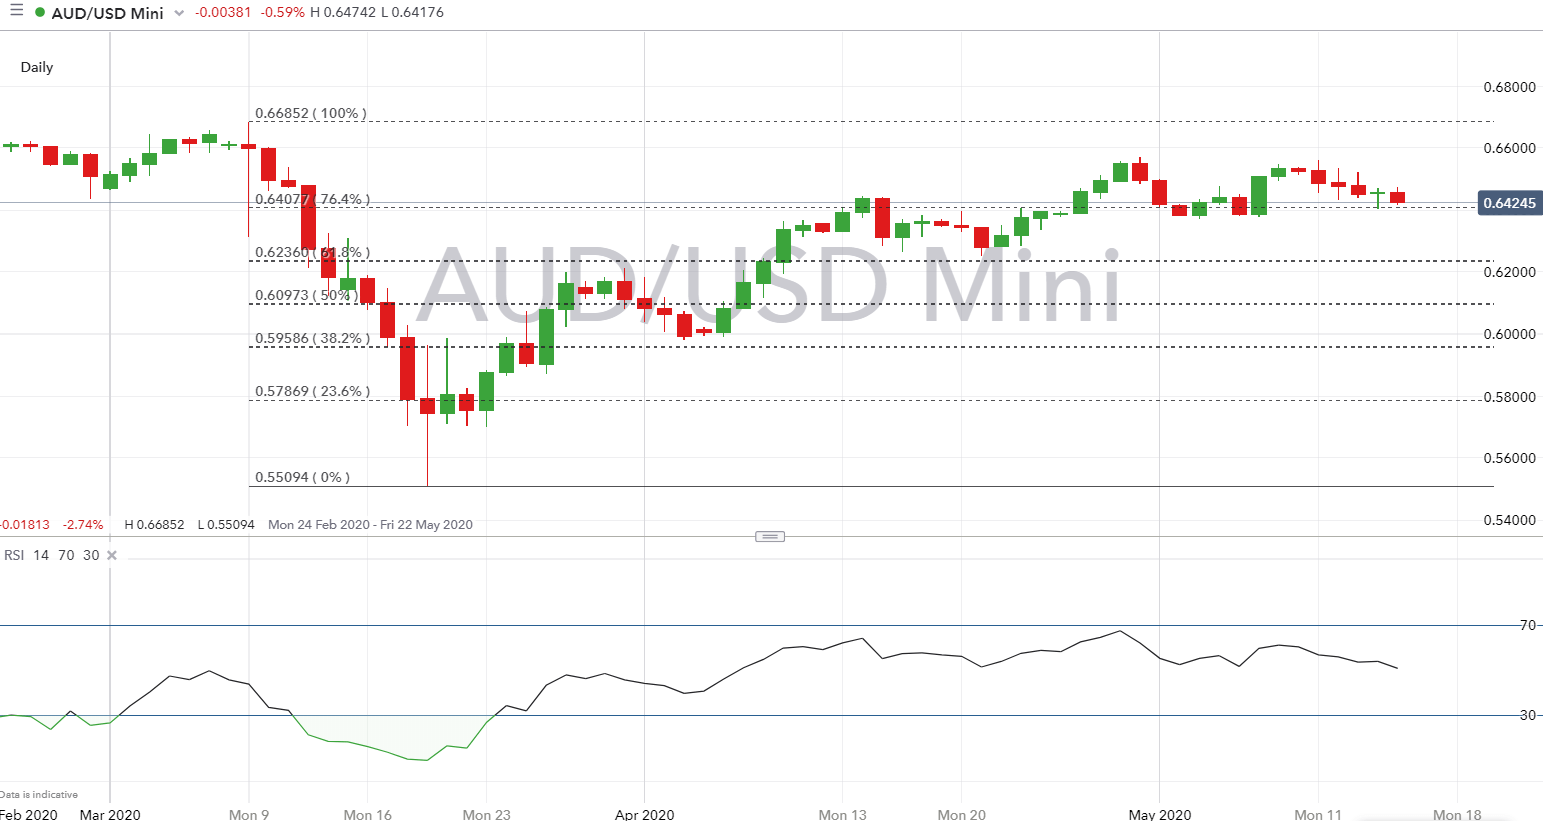
Source: IG Charts
--- Written by Justin McQueen, Market Analyst
Follow Justin on Twitter @JMcQueenFX


