Gold Price (XAUUSD) Analysis, Price and Chart
- Gold unable to test multi-year highs.
- 20-day moving average is being probed.


Gold Sentiment Dampened by Revitalized Risk Appetite
The price of gold is trading either side of $1,700/oz. as risk markets continue to turn higher. The gradual unwinding of coronavirus lockdown measures announced in Europe has cheered equity markets, while the US money printing machine may soon go into overdrive, if commentary by the Speaker of the House is acted on. Speaker Nancy Pelosi said yesterday that it may be time to consider a guaranteed minimum income during the coronavirus outbreak, getting money to where it is needed the most.
The economic calendar is full to the brim with potential market moving data for the rest of the week, starting with US consumer confidence later today with the market expecting a sharp downturn to 88 from last month’s reading of 120. On Wednesday, a combination of US Q1 Q/Q GDP, expected at -4.0% and the latest FOMC meeting will have the ability to move the US dollar and gold.
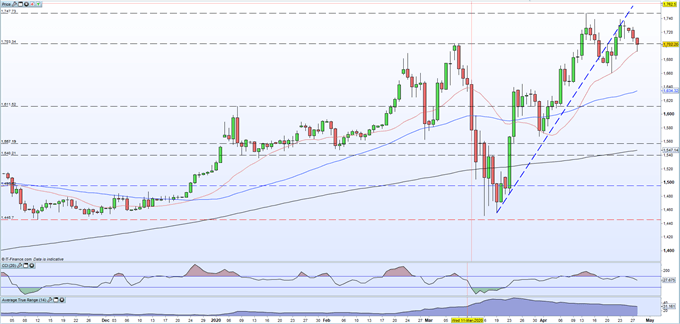
The daily chart shows gold unable to break back above the late-March trendline despite repeated attempts last week. This week’s Gold Technical Forecast noted the magnetic effect of the uptrend but warned that further refusals at this trendline may suggest buyer exhaustion. A series of lower highs over the past four days points to a weakening market with a break above $1,728/oz. needed to negate this. Gold has respected support off the 20-day moving average this month and today’s test continued this trend. A break and close below here may suggest further downside.
How to Trade Gold: Top Gold Trading Strategies and Tips
Gold Daily Price Chart (November 2019 – April 28, 2020)


What is your view on Gold – are you bullish or bearish?? You can let us know via the form at the end of this piece or you can contact the author via Twitter @nickcawley1.


