


Gold Price (XAUUSD) Analysis, Price and Chart
- Gold has rallied 19% since March despite two corrective sell-offs.
- A further break higher may be being set-up.

Gold Eyes $1,747/oz. as Bullish Momentum Continues
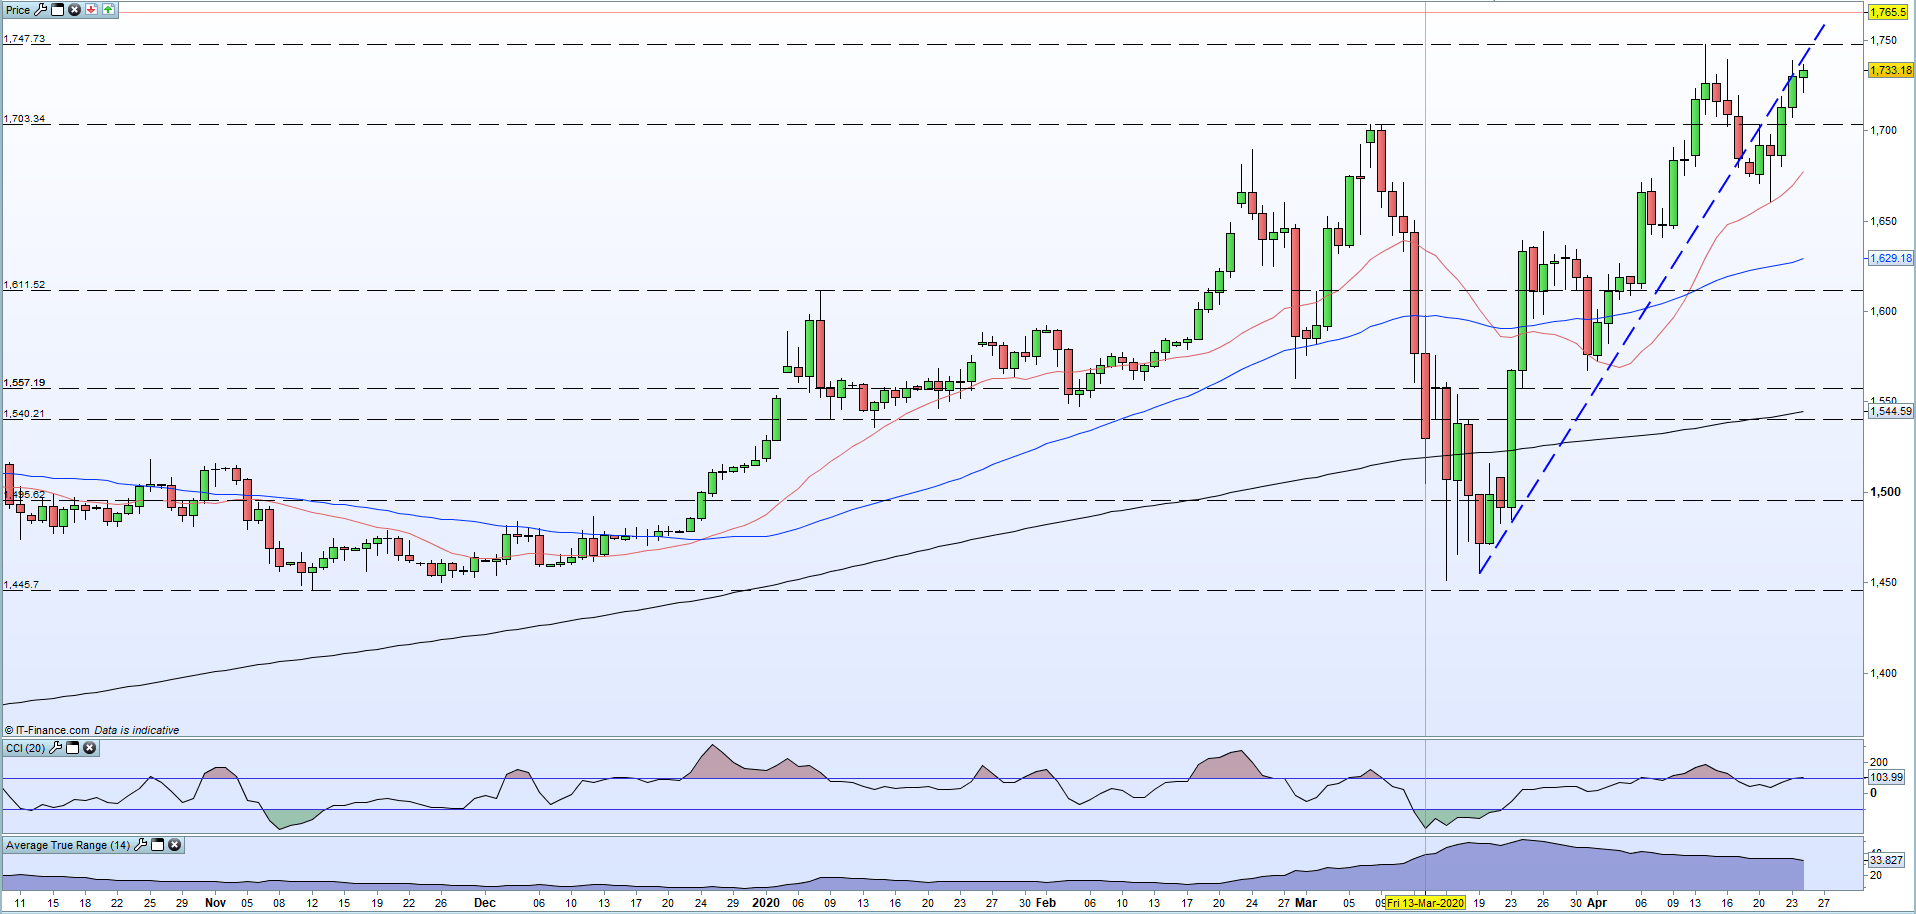
The strong upward trend shown on the daily chart is seemingly intact and offers hope for a new seven-and-a-half high if confirmed. A short-term pattern of higher lows in the last four days and the seemingly magnetic pull from the trendline off the March 19 low confirms that buyers remain firmly in control of the market for now. Friday’s price action is muted compared to the previous four days with the spot price attempting to break back above trend for the first time in over a week.
If this break higher happens, gold will be touching the April 14 recent high. A break and close above $1,747.7/ox. would suggest that the October 2012 high at $1,796/oz. is the next technical level of resistance. All three moving averages are supportive and while gold may be entering oversold territory, using CCI, it is still significantly lower than the recent peak made on April 14.
A word of caution needs to be introduced despite the positive sentiment in the market. The spot price while drawn to trend has been unable to break and close higher this week. Further refusals at this trendline may suggest buyer exhaustion after the recent sharp rally and a retrace back to the $1,703/oz. to $1,707/oz. zone may be seen. Traders should continue to monitor the US dollar and overall market risk sentiment as additional signals to gold’s short-term future.
How to Trade Gold: Top Gold Trading Strategies and Tips
Gold Daily Price Chart (October 2019 – April 24, 2020)

What is Gold? Understanding Gold as a Trading Commodity
What is your view on Gold – are you bullish or bearish?? You can let us know via the form at the end of this piece or you can contact the author via Twitter @nickcawley1.


