Gold Price Analysis, Price and Chart
- USD2 Trillion stimulus package may temper gold’s ascent.
- Gold buffeted by dislocation between paper and physical prices.
Weekly Technical Gold Analysis
Gold’s Volatility Questions the Precious Metal’s Safe-Haven Status
Just three days into the week and already gold has traded in a $155/oz+ range as volatile market conditions make accurate price discovery extremely difficult. In addition, there has been a dislocation between the spot and futures price of gold, with the spread widening sharply between the two, prompting fears that physical delivery of gold may prove difficult. This has fueled volatility this week with the CME exchange today increasing margins on gold futures by 19.3%, the first time this has happened in over a decade, in a move to dampen speculative activity.
The US government and Congress are said to be finally announcing a USD2 trillion rescue package early this afternoon after days of heated negotiations. This unprecedented boost is designed to shore up the US economy immediately by providing direct financial support for small- and medium-sized companies and their employees. This boost comes on top of other recently announced packages by the Federal Reserve including an open-ended commitment to buying bonds (QE).
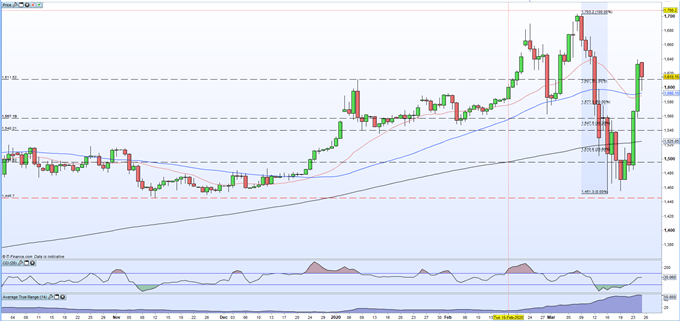
Against this backdrop, gold should be moving lower. In addition, recent price moves are casting doubt on whether gold is an effective risk-haven in the current environment. The daily chart highlights recent volatility, at its highest level since early 2017, and makes accurate technical analysis difficult. Support is seen around $1547 - $1,560/oz. off short-term Fibonacci retracement and prior daily lows, while to the upside, bulls will try and re-test Tuesday’s $1640/oz. before the $1,703/oz. multi-year high comes into focus. Current price action around 61.8% Fibonacci around $1,608/oz. may provide clues going forward.
Strong risk management is a prerequisite when trading gold in these highly volatile times and traders should consider their trading size and stop-losses very carefully.
Becoming a Better Trader – Principles of Risk Management (Videos)
Gold Daily Price Chart (October 2019 – March 25, 2020)


Trading the Gold-Silver Ratio: Strategies and Tips
Traders may be interested in two of our trading guides – Traits of Successful Traders and Top Trading Lessons – while technical analysts are likely to be interested in our latest Elliott Wave Guide.
What is your view on Gold – bullish or bearish?? You can let us know via the form at the end of this piece or you can contact the author via Twitter @nickcawley1.


