


Gold Price Analysis, Price and Chart
- Gold’s sharp sell-off may have found a level of support.
- Trading volatile assets demands a disciplined approach

Gold Shies Away from Late-November Low
A range of fundamental factors forced gold over the week, before Friday’s relief rally tempered losses, but the backdrop remains cloudy. Gold’s safe-haven status is currently being questioned as the US dollar runs amok, but the daily chart is showing of reduced selling pressure, despite highly volatile market conditions. For the precious metal to rebound further, volatility needs to calm and the long-term moving average needs to be broken and closed above.
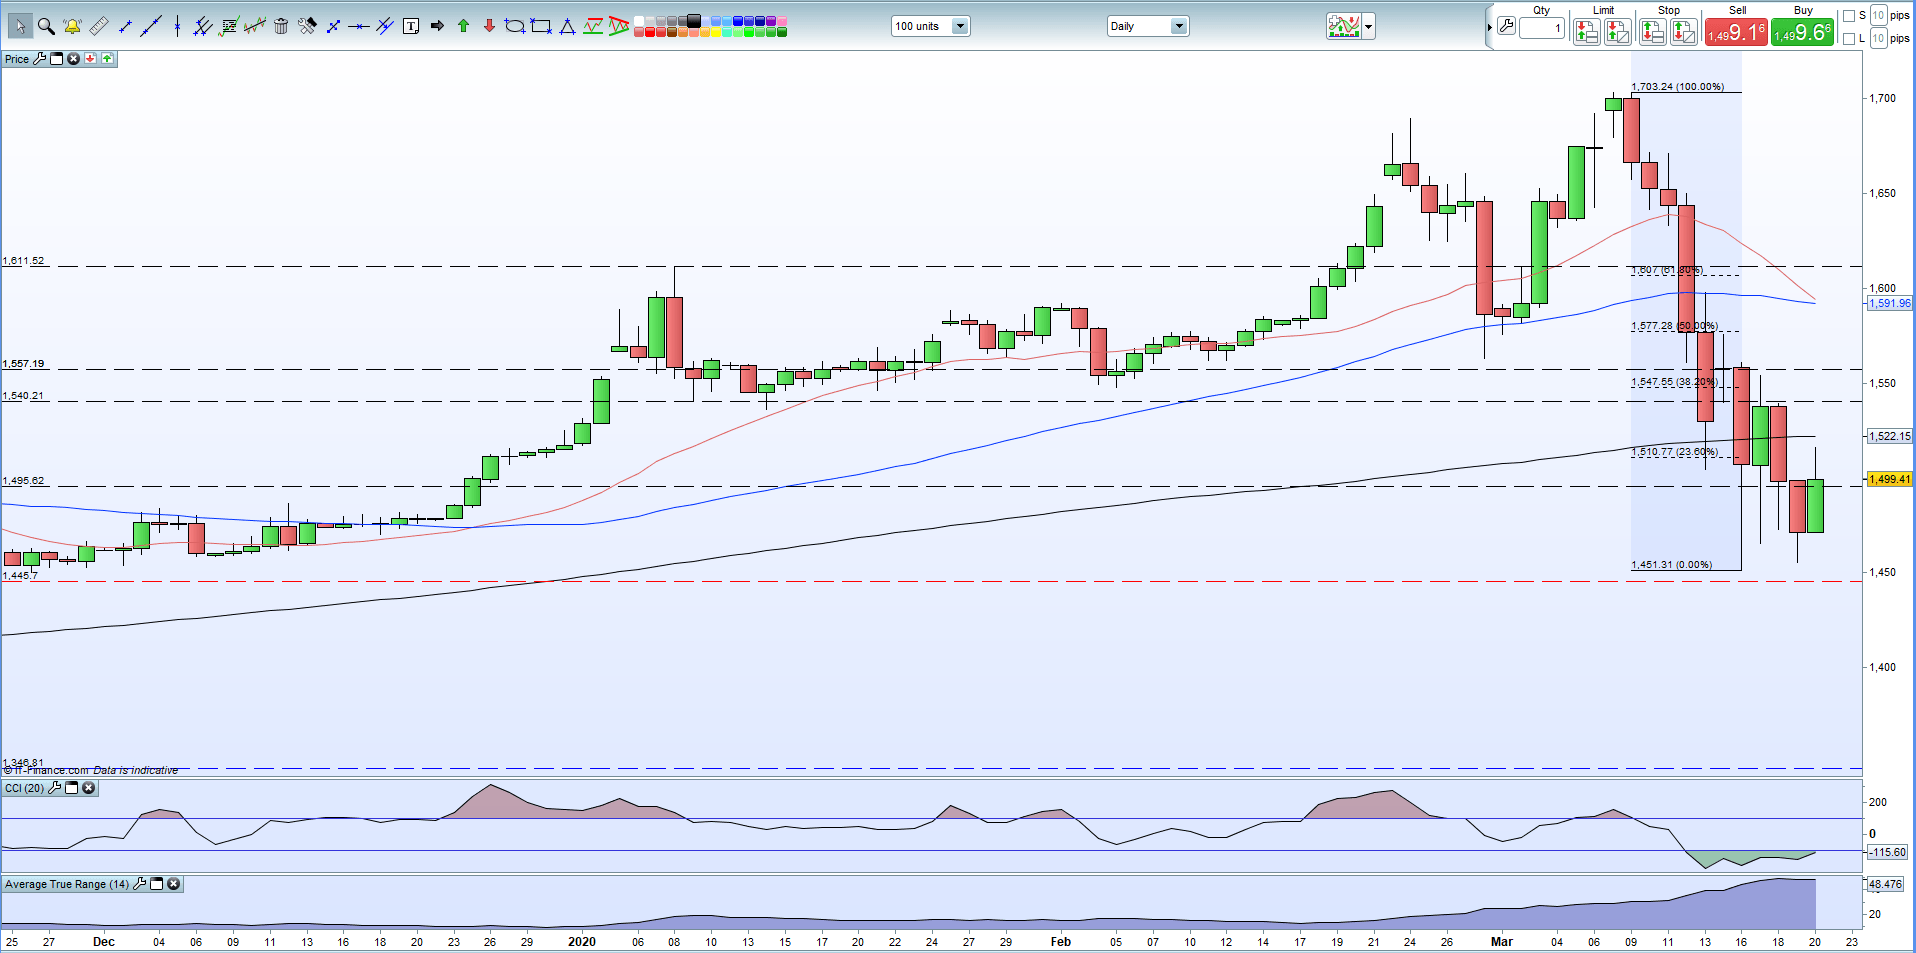
Short-term Fibonacci levels show 23.6% retracement at $1,510.7/oz. and 38.2% retracement at $1,547.5/oz. with the 200-dma in between around $1,522/oz. A break and close above this longer-dated moving average is needed if gold is to lose its current negative sentiment. A series of lower highs off the March 9 peak has been broken today and needs to be consolidated, while fresh higher lows early next week would also aid bullish sentiment. To the downside, the late-November low at $1,445.7/oz. held this week and could continue to provide support looking ahead. Ahead of this, recent daily lows between $1,465/oz. and $1,472/oz. may cause sellers to pause.
The ATR indicator shows the extreme levels of volatility in the gold market, making trading difficult. Traders need volatility in a market, but the current levels are causing wild swings that indiscriminately take out stops, especially if they are set too tight. Traders may need to pare back their trading size when considering a gold trade to allow themselves more room on their stop loss. Strong risk management is a prerequisite when trading, and doubly so in these markets.
Becoming a Better Trader – Principles of Risk Management (Videos)
Gold Daily Price Chart ( – March 20, 2020)

Trading the Gold-Silver Ratio: Strategies and Tips
Traders may be interested in two of our trading guides – Traits of Successful Traders and Top Trading Lessons – while technical analysts are likely to be interested in our latest Elliott Wave Guide.
What is your view on Gold – bullish or bearish?? You can let us know via the form at the end of this piece or you can contact the author via Twitter @nickcawley1.


