


The US stock market remains well-bid, with nothing seemingly able to derail it. The Dow is strong while the Nasdaq quite strong. The market is heading higher at the moment and until we see any real selling come, it’s hard to hold anything but a bullish bias until further notice. Perhaps the Dow will see 30k soon. One big psychological level to keep an eye on with the Nasdaq, is 10k, and not just because it’s “10,000” but also because it aligns with a major long-term bullish parallel. For more on this, you can check out last week’s Nasdaq technical outlook.

Dow Jones Daily Chart (pointed higher)
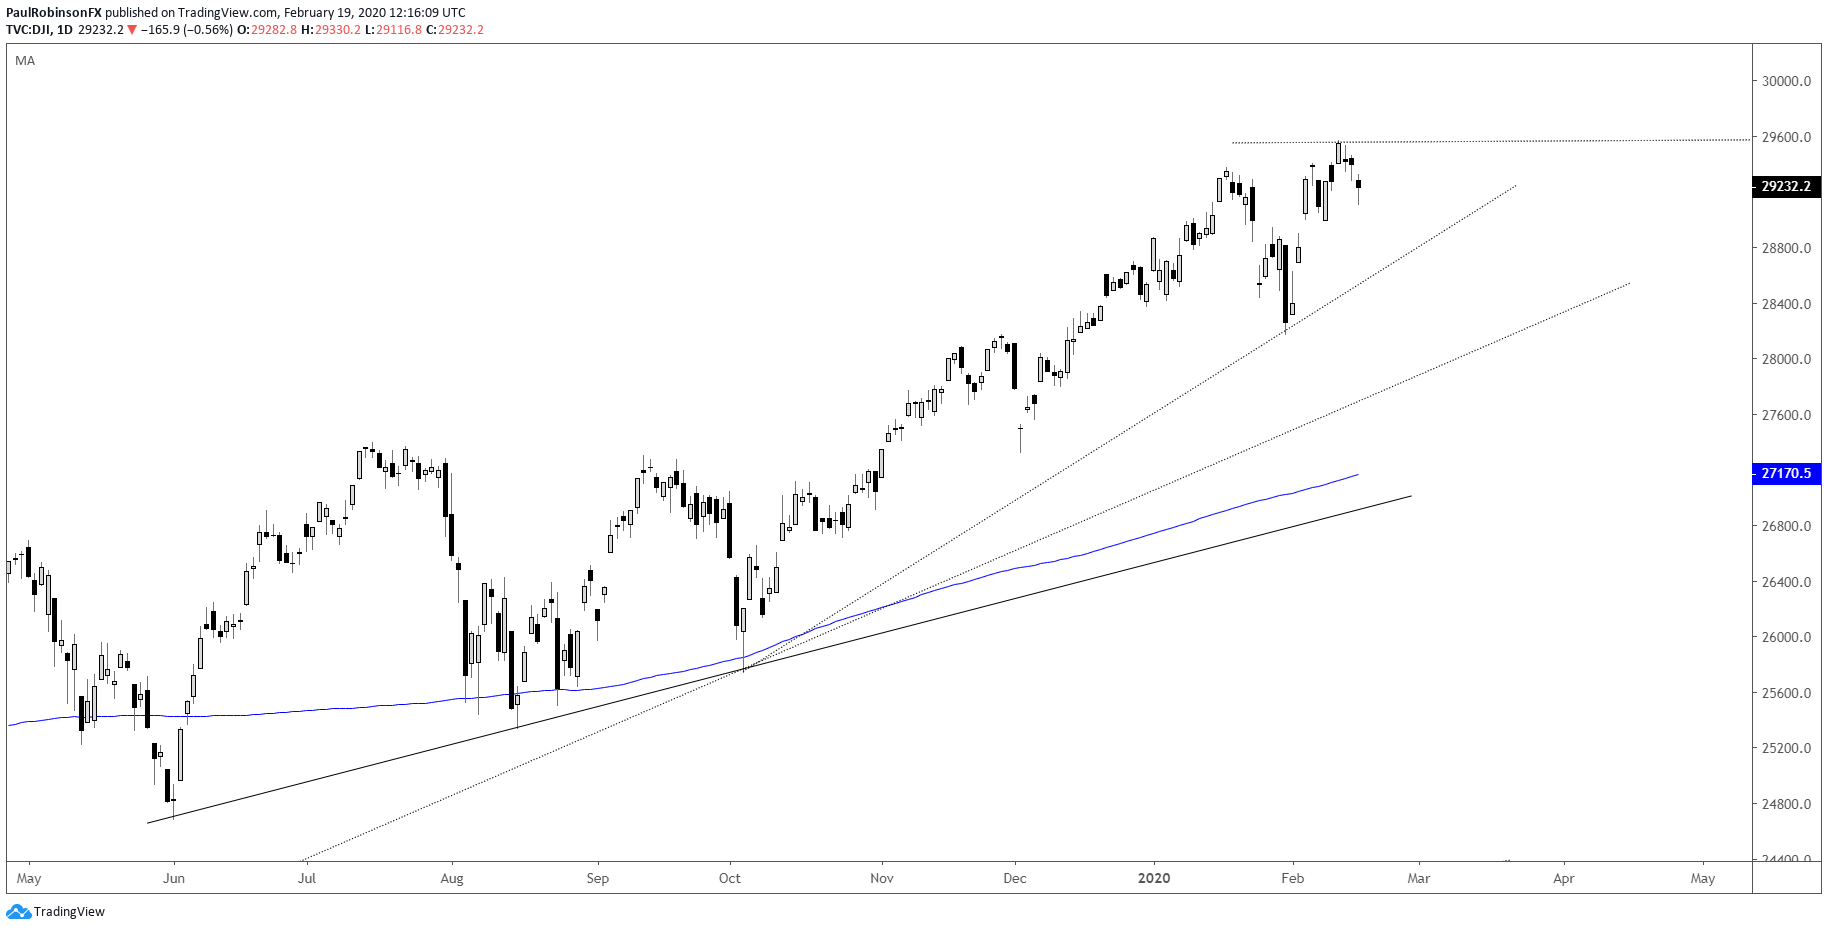
Dow Jones Chart by TradingView
Crude Oil is working on a recovery bounce at the moment from just near the 2016 trend-line. It’s hard to say if it is only a correction or a real-deal rally. For those looking to establish bullish bets, it might be a choppy ride higher, so taking cracks at longs on short-term weakness looks like the most prudent way to play.

Crude Oil Daily Chart (recovering for now)
Crude Oil Chart by TradingView
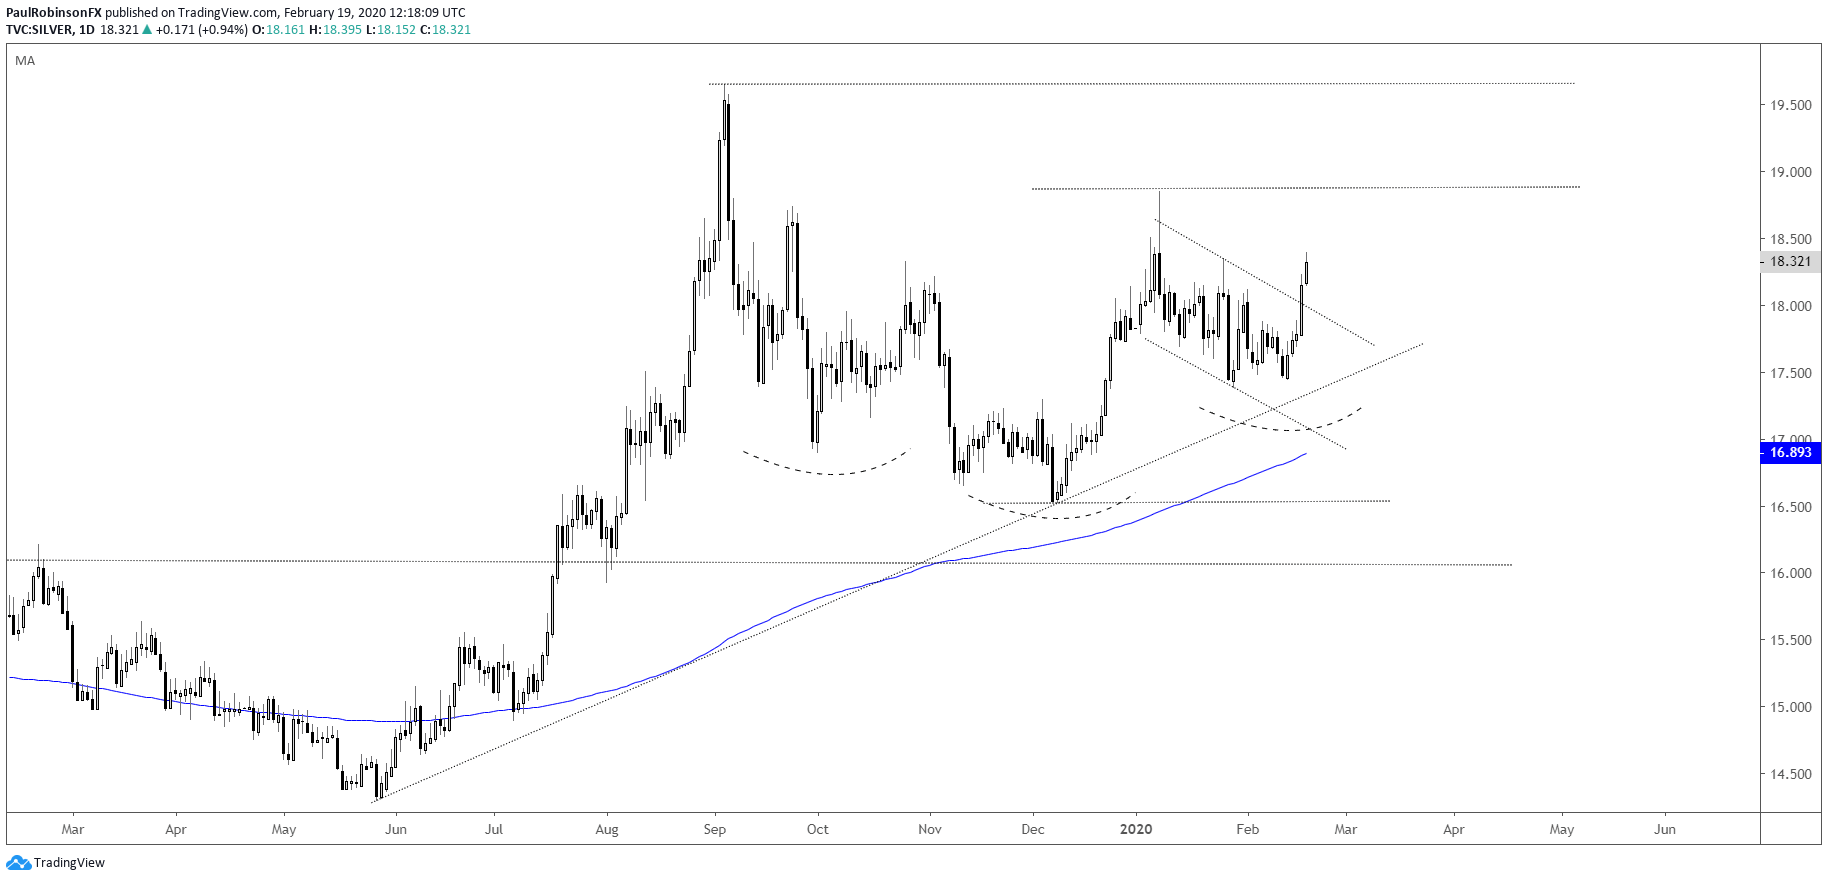
Silver is doing its best to trade higher, and with gold very near a breakout above 1611 we might see it try and on through its own January 8 high at 18.85. It’s been lagging behind gold, but keep an eye on it for potential to play catch-up at some point. Even if it doesn’t the broad base built over the last few months should help see silver higher in the intermediate-term, and eventually above the 2019 high at 19.64. It will take a firm break below 17.38 and the trend-line from May to threaten a generally constructive outlook.
Silver Daily Chart (breaking out of bullish sequence)
Crude Oil Chart by TradingView
To see all the charts we looked at, check out the video above…
Resources for Index & Commodity Traders
Whether you are a new or an experienced trader, DailyFX has several resources available to help you; indicator for tracking trader sentiment, quarterly trading forecasts, analytical and educational webinars held daily, and trading guides to help you improve trading performance.
We also have a series of guides for those looking to trade specific markets, such as the S&P 500, Dow, DAX, gold, silver, crude oil, and copper.
---Written by Paul Robinson, Market Analyst
You can follow Paul on Twitter at @PaulRobinsonFX


