


Dollar, USDJPY and IndicesTalking Points:
- The Phase One trade deal was used as justification for extending the Dow and S&P 500 rally
- Growth is a top theme to end the week with Chinese 4Q GDP on tap
- Deciding your view on range, breakout or trend conditions is important with key tech level in view

The Phase One Trade Deal Offers Disproportionate Enthusiasm
There is still an afterglow from the United State and China’s official signing of the Phase One trade deal – never mind the very open skepticism around what the agreement actually offers in tangible growth. As a recap, China signaled it would increase purchases of US goods (US sources say $200 billion worth) and monitor intellectual property rights while the US removed its currency manipulator status against its counterpart and rides off its avoiding tariff escalation in October and December. This doesn’t address matters such as Huawei and policing technology transfers, but the biggest red flag against growth is the maintenance of the $360 billion in goods being taxed at the two countries’ borders. There is much that can be questioned in this development, but the market behind the US indices have not been in a questioning mood. The Dow and S&P 500 gapped higher on Thursday’s open and continued readily to fresh record highs through the end of the session.
Chart of DIA with 20-Day Moving Average and Gaps (Daily)
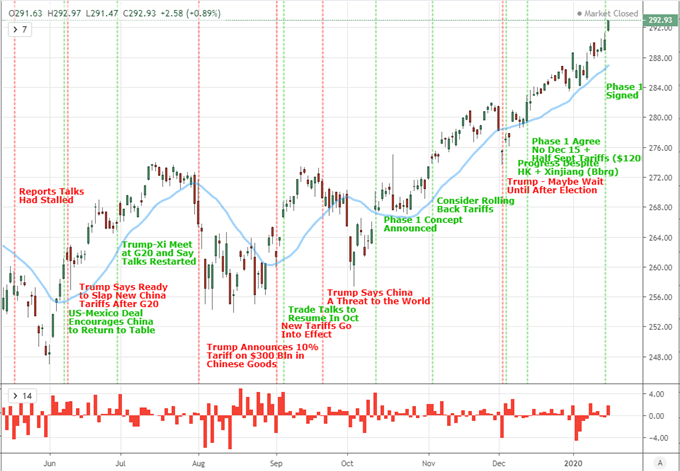
Chart Created with TradingView Platform
I remain dubious of the general sentiment view offered up by the US stock market itself. There remains a large deviation in performance between he like of the Dow and many other assets with a risk designation. Perhaps one of the most appropriate comparisons for contrast is the performance of global indices. I like to reference the VEU ‘rest of world’ ETF, but there is a notable posturing below resistance for the German DAX, UK FTSE100 and Japanese Nikkei 225. Further afield, emerging markets, carry trade and commodities are similarly showing a lack of outright speculative appetite as well as confidence that the global economy has changed its course for the better. Other highlights for global trade include the USMCA vote in the Senate which didn’t seem to budget the Canadian Dollar or Mexican peso significantly. In contrast, concern that the US will turn its gaze onto Europe after months of threats seems to be gaining serious traction. Perhaps that is further tempering the Euro and European indices.
Chart of DAX Index with 100-Day Moving Average (Daily)
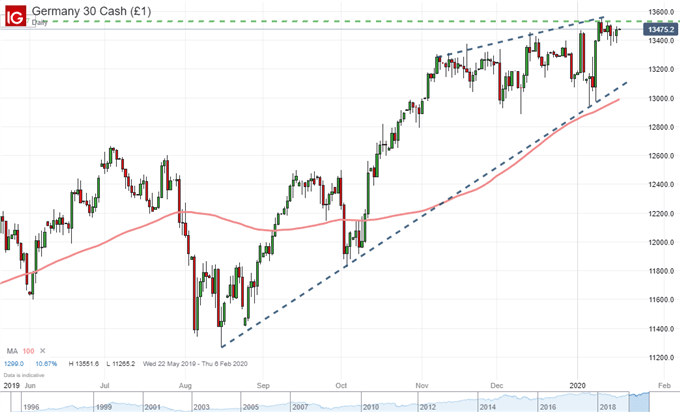
Chart Created with IG Trading Platform
Growth and Monetary Policy Struggle to Trigger Breakouts or Reversals
Looking ahead to the final 24 hours of this trading week, there are a few more fundamental sparks to mind; but the burden to override complacency remains particularly high. At the top of the market Richter Scale is the Chinese 4Q GDP release. The health of the second largest economy in the world and the target of the onerous trade war is naturally a top priority for those monitoring the vitals of the global economy and financial markets. That said, this series has a notorious history of surprisingly small moves and even smaller ‘surprises’ (relative to forecast) from quarter to quarter. Nevertheless, with the economy running at its slowest pace in decades, even measured moves can draw serious concern. Other growth measures like European construction, UK retail sales and US consumer confidence (UofM) will register, but the impact will be shaped by the twilight of liquidity. It isn’t impossible to move markets, but the surprise may need to be bigger to register.
Chart of USDCNH and 20-Day Moving Average (Daily)
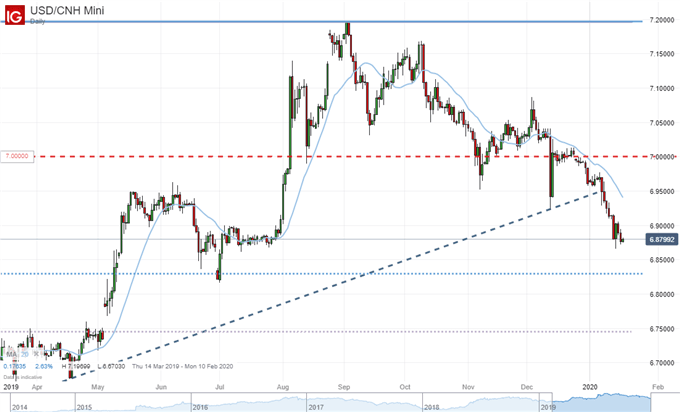
Chart Created with IG Trading Platform
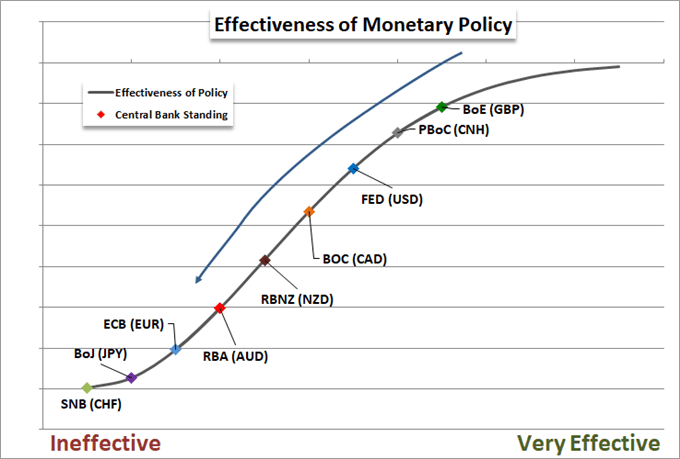
Another theme of merit this past session - and more heavily into the next trading week - is monetary policy. This past session, the European Central Bank (ECB) released the minutes of their previous meeting. Among the various highlights was the repeated concern among a few members that the group more closely track the detrimental side effects of extreme accommodation. This is a serious concern among traders that are mindful of the confidence built on this decade of external support and the concept seems to be slowly seeping into the minds of the people directing the aid. There is considerable weight afforded to accommodative monetary policy and is ability to buoy risk trends. If this conviction falters or the naturally receding tide in the markets overwhelms their capabilities, the effect can be severe. Looking further ahead to next week, the ECB and BOJ – two of the most dovish major central banks – will inform the strategy at the lower bound.
The Dollar and Yen Crosses Weigh Their Own Ranges
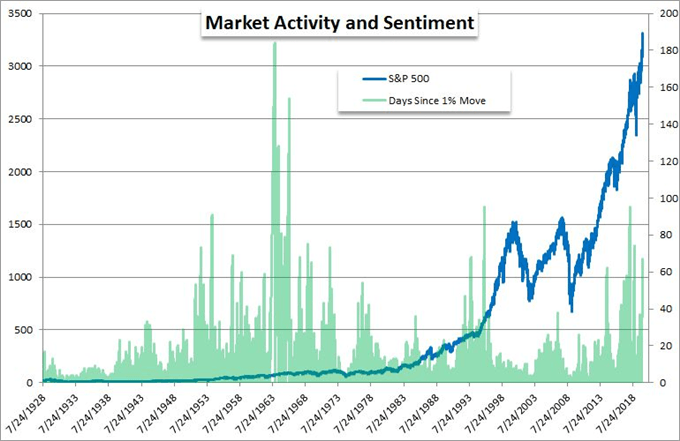
As discussed yesterday, it is important to determine where you stand on the status of the broader financial markets – whether it is fundamentally range, breakout or trend oriented. That is not to say there aren’t outliers or areas more prone to a different type relative to the majority; but the idea is to find the most ubiquitous conditions to favor probabilities. In my poll, conducted in Twitter, the majority (40%) thought that we were currently supporting trends. Those voting for range and breakout were evenly split (30%). I fall in the category supporting ranges. The favorite exception to this is also the leading example for risk trends: US indices. While the S&P 500 has advanced these past three months, the pace has been particularly restrained. In fact, conditions are so restrained that it has been 67 consecutive trading sessions since the benchmark has experienced a 1 percent movement either higher or lower. There are only four other instances of quiet to that magnitude in roughly the past four decades. That doesn’t feel like a trend backdrop.
If I’m looking for range scenarios, there are explicit risk assets that can qualify. However, my interests lean more towards the Dollar and Yen crosses. For the DXY Index, we have seen a descending channel resistance rejection this past session that transfers directly over from the likes of EURUSD and GBPUSD. In contrast, the Yen crosses fall within that grey area where some would say they are on the cusp of a breakout and others are expecting the technical ceiling to hold and send the markets back along the path of least resistance. EURJPY, GBPJPY and CADJPY may seem like short-term breakout candidates, but the big picture holds their conformity to bounds that are years in the making. Combining the Dollar and Yen and we have a pair on the cusp. USDJPY is testing 110 which is the upper bound of a symmetrical triangle that is over six years in the making. Where do you stand on it?
| Change in | Longs | Shorts | OI |
| Daily | -2% | 2% | 0% |
| Weekly | 12% | -16% | -6% |
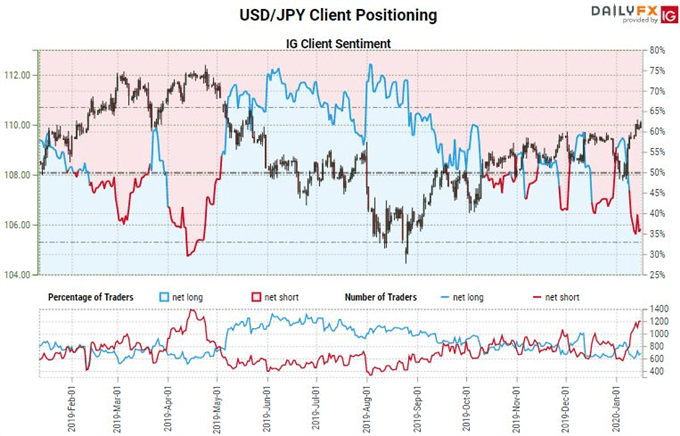
Chart Created with IG Trading Platform
If you want to download my Manic-Crisis calendar, you can find the updated file here.
.


