


- US crude oil is down over 17% since mid-September.
- Low prints between $50.52/bbl. and $50.90/bbl. may prove supportive.
Q3 2019 Oil Forecasts and Top Trading Opportunities
How to Trade Oil: Crude Oil Trading Strategies and Tips
Crude Oil Moving Towards Bear Market Territory
US crude oil has fallen sharply since printing a multi-month high of $63.56/bbl. on September 15 this year, losing 17% in less than three weeks. According to a commonly used market metric, if the price of an asset falls 20% or more, a bear market has been entered.
How to Determine a Bull or Bear Market
The fundamentals behind the recent sell-off remain unchanged as global growth prospects diminish, and political tensions heighten. These all remain in place with the added negative of a ratcheting up of trade war tensions between the US and the EU.
Crude Oil Price Forecast: Undermined by China Slowdown, Political Moves
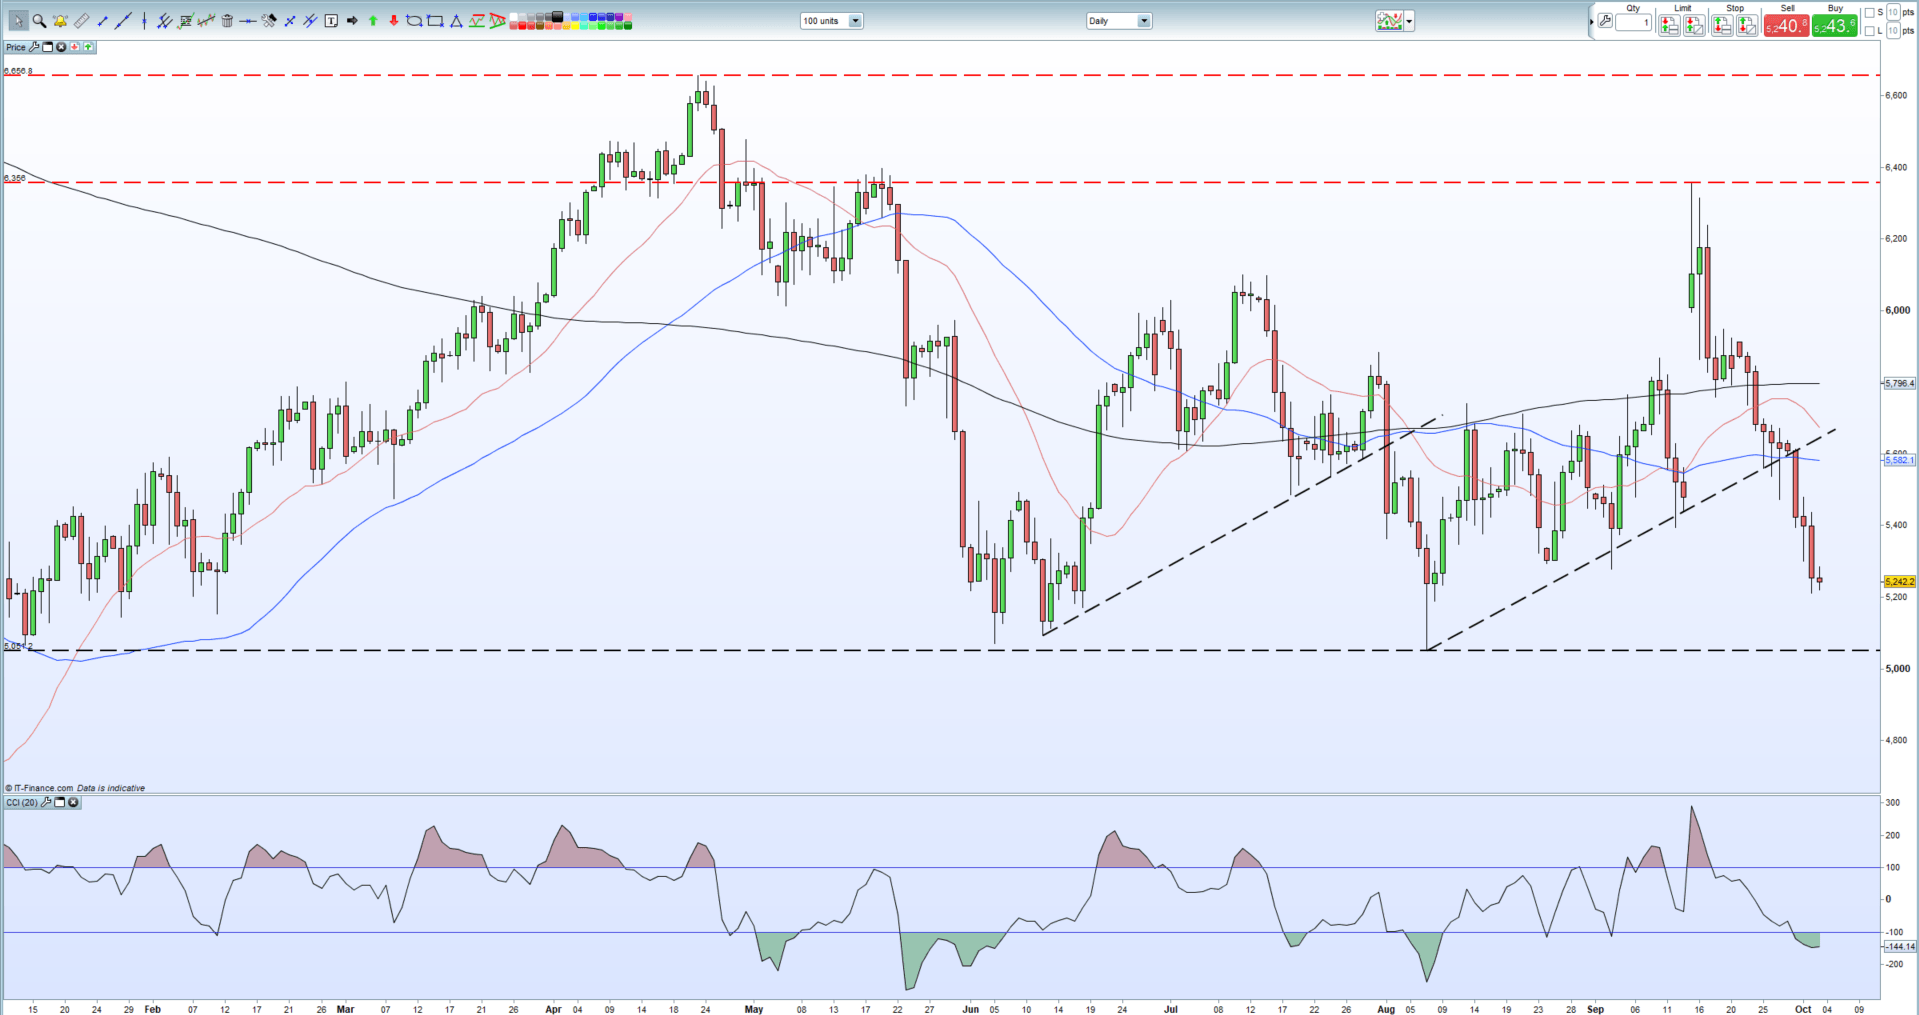
The daily chart below shows that the recent sharp sell-off has occurred before and may point to a price reversal zone slightly lower down. The uptrend started in early June this year also saw a sharp breakdown through trend support and took the price back down to support around $50.50/bbl. The recent uptrend, started off that low, has also seen a sharp break through trend support with the current spot price just $2/bbl. away from the prior reversal low. The CCI indicator highlights that the market is in oversold territory, while IG client sentiment – see below – shows retail heavily long oil. If history repeats itself, then oil may look to stabilize or even reverse its recent slump when it nears the $50.50-$50.90/bbl. zone, underpinned by potential ‘big figure’ support at $50/bbl. The size of the recent bear candles indicate that the market price action is volatile, and this is expected to remain the case in the near-term.
Crude Oil Price Daily Chart (January – October 3, 2019)
The IG Client Sentiment Indicator shows retail traders are 82.0% net-long US crude oil, a bearish contrarian bias.
Traders may be interested in two of our trading guides – Traits of Successful Traders and Top Trading Lessons – while technical analysts are likely to be interested in our latest Elliott Wave Guide.
What is your view on Crude Oil – bullish or bearish?? You can let us know via the form at the end of this piece or you can contact the author at nicholas.cawley@ig.com or via Twitter @nickcawley1.


