


How to Determine a Bull or Bear Market

Bull and bear markets are two very different animals - in more than one way. The ability to discern whether you are in a Bull market (going up) or a Bear market (going down) is fundamental for traders and investors alike. And if you can identify when the market is changing from one bias to the other, then you can put yourself in a position to benefit from a market that is moving either up and down.
We will look at how fundamental and technical analysis can help you identify when the market is ‘nearing a turn’ and how you should look to position yourself to take advantage of this move.

Differences Between a Bull and Bear Market - Talking Points
- Traders should know how to confidently approach, enter and exit both Bull or Bear markets.
- Macro-fundamental shifts normally signal market shifts.
- Positive sentiment helps fuel a Bull market and negative sentiment a Bear market.
- Bear market moves tend to be more volatile.
- Technical analysis can help pinpoint market entry and exit points.
- See a real-life example of a changing market.
What is a Bull Market?

Bull markets are characterized by rising prices, ongoing positive sentiment and a positive economic backdrop. A common metric used to define a Bull market is when the price of an asset has moved 20% higher from its recent, significant low. Bull markets can last for months or even years.
What is a Bear Market?

A Bear market is diametrically opposite to a Bull market and is characterized by falling prices, low or negative sentiment and, normally, a weakening economic backdrop. Bear markets can produce violent price swings and moves can also last for months or years – though they tend to unfold more quickly than their counterpart.
If you want to look at more extreme versions of Bull and Bear markets to draw more direct lessons, the links below highlight major historical moves and how to trade a transitional event:
- A Brief History of Major Financial Bubbles, Crises and Flash-Crashes.
- Four Step Guide to Trading Breakouts in Forex.
- Market Cycles – Phases, Stages and Common Characteristics.
Fundamentals are Signposts to a Bull or Bear Market

Fundamental analysis helps traders paint a contemporary landscape of a financial market, allowing them to then ‘dig down’ using other analytical tools and techniques. The role of a central bank is crucial in modern financial markets and they should be followed closely to determine the current state of the economy and the future path of interest rates.
If a central bank announces that it is changing its monetary policy stance or that the economy is now expanding/contracting, then foreign exchange and fixed income markets will also change their price/value to reflect this. In addition, the political landscape needs to factored in, along with any trade disruptions or disputes both internally and with external partners.
Stock and share fundamentals are slightly different as they tend to be more company-focused, looking at metrics including: cash flow, dividends, earnings, return on investment and management history and competence among other considerations.
Sentiment an Important Driver

Market sentiment has a very important role to play when deciding if an asset class is on the cusp of a turn or not. Sentiment is seen as the overall market tone with an optimistic, positive sentiment a driver of a bull market, while a negative or pessimistic market bias will normally see prices driven lower.
“Greed” and “fear” are the extremes of the spectrum, with a bull market drawing in investors who look to jump on the trend, while a bear market rife with those clamoring to cut risk will also attract short-sellers who look to profit from falling prices. When these indicators hit extreme levels, they may also suggest that a market is about to turn as positioning becomes too one-sided, leaving the trend vulnerable to reversal.
Contrarian sentiment indicators can also prove very useful in gauging a market move, as traders look to go against extreme levels of fear and greed.
- How to Manage Fear and Greed in Trading.
- The IG Client Sentiment Indicator – A contrarian indicator which shows, daily and weekly positional changes and overall retail bias on a wide range of asset classes.
Bear Markets Can be Very Volatile

In a bull market, traders are confident of the market backdrop and are prepared to invest or trade and hold positions for longer. In a bear market, uncertainty stalks the market leaving traders constantly worried about falling prices. If you are short in a bear market, it can become difficult to continue holding your position - and your nerve - due to this over-riding uncertainty and the fear of a sharp reversal. This uncertainty adds volatility to the market as traders can be swayed into buying and selling at levels they would not normally consider, due to erratic price action.
Large price falls can also tempt buyers back into the market – ‘Buy the Dip’ – who then sell their position quickly when prices keep falling, again adding to negative sentiment and erratic price action. The adage remains true – ‘Don’t Try to Catch a Falling Knife’. Remember it is common to see a short-term bull move in a long-term bear market and the other way around.
Technical Analysis is Drivenby Price Action and Nothing Else
Technical analysis is the use of statistical analysis to help evaluate the price of an asset or market. By using historical trade data, including price and volume, traders can build a chart and see if an asset or a market is undervalued or overvalued and identify timeframes over which these conditions may reverse or extend. Active traders may use charts with timeframes as short as one minute while longer-term investors may use daily or weekly charts to help them determine their view when making a more informed trading decision.
There are many different price trends that can help traders ‘predict’ future moves.
These include:
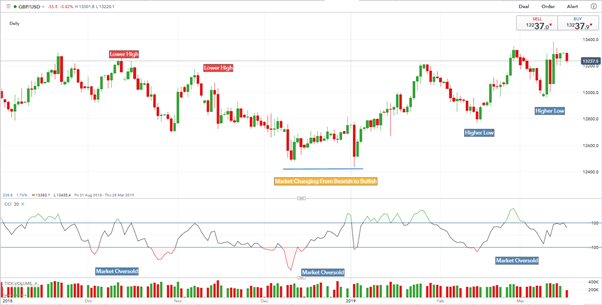
- Directional price trends – an upward trend with higher highs and higher lows confirms a bull market, whereas a downward trend with lower highs and lower lows confirms a bear market.
- Historical price patterns – many technical analysts look to the past to help predict the future. Does an asset always rally or fall at a certain price level on a chart and if so how many times has this occurred? Does one asset have a direct relationship with another – correlation – and if so, how accurately are the two markets correlated and are there any time lags between moves?
- Volume can help identify market changes – if an asset suddenly reverses direction on a larger-than-normal volume, traders should be aware that a change in direction may be taking place. If the move is on small or normal volume, then a reversal is more unlikely. If the volume in an uptrend is falling, it is likely that the momentum of this move is slowing, another sign of a potential market reversal.
Market Changing from Bearish to Bullish
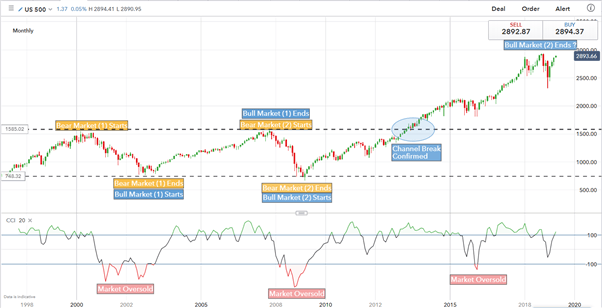
S&P 500 Changing Between a Bull and Bear Market
The chart below shows how the S&P 500 has changed between a bull and bear market – and back again – over the last 23 years. While the chart shows when and where the market reversed it is important to also look ‘behind the scenes’ and see what fundamental changes drove the market.
The first bear market started in early 2000 as the dot-com bubble burst after the extreme equity market valuations applied to a range of internet companies fell abruptly. As greed turned to fear, investors dumped stocks until the market found an equilibrium and steadied, ending the bear market phase.
In March 2003, the financial markets began to turn higher, aided by increased infrastructure spending and tax cuts initiated by US President Bush. These tax cuts - macro-fundamental shifts - helped to fuel consumer spending and economic growth until the global financial crisis of 2008 took hold of markets.
In late 2007 and early 2008, a collapse in US house prices – then a mainstay of consumer wealth – and a slowdown in US growth sent equity prices heading sharply lower. The US government was forced to intervene to save ailing investment bank Bear Stearns before then propping up Fannie Mae and Freddie Mac, two government-sponsored mortgage agencies, who had bought hundreds of billions of sub-prime home loans. From September 2007 to March 2009, the S&P 500 fell by nearly 60% as negative sentiment ran riot.
In 2008, the US economy fell into a recession and the Federal Reserve needed to act fast. With interest rates already near zero, the central bank embarked on three different rounds of quantitative easing (QE) to inject money into the economy via buying US government bonds and mortgage-backed securities. In total, between 2008 and late-2015, the Federal Reserve’s balance sheet grew from $900 billion to $4.5 trillion, via three rounds of QE.
S&P 500 Monthly Chart 1996 – April 2019
Determining a Bull or Bear Market - Conclusion
This article has pointed to a variety of ways that market movement can be identified using fundamental and technical analysis. As with all aspects of trading, practice and knowledge are invaluable and will help you identify market moves and sentiment quickly and more reliably. Bear markets can move very quickly as negative sentiment fuels sharp price movements while ‘most’ Bull markets move at a slightly less frantic pace. Remember that within both Bull and Bear markets, short-term moves in the opposite direction can occur without nullifying the major trend - and that opportunity can be found in either direction.
If you’re new to Forex Trading and would like to learn more from the experts, download one of our Free Beginner Trading Guides.
We have produced a Free Trading Journal for both beginner and advanced traders with tips on how to use it.