


Bitcoin Price Forecast:
- Bitcoin is 165% higher in the year to date, but has lost roughly 20% of its value since late June
- A series of lower highs and slightly higher lows has formed a pennant pattern
- Regardless of direction, weeks of tight price action could see the return of volatility when a breakout eventually occurs
Bitcoin Price Chart Forecast: BTCUSD Awaits Pennant Breakout
Bitcoin trades narrowly above $10,000 heading into the third weekend of September, regaining ground from a volatile Thursday which saw price whipsaw between $9,545 and $10,385. Respecting both the lower and upper bounds of the pennant pattern which it has formed, Bitcoin has seen increasingly tight price action in September as the coin’s average true range slips. With the coin quickly running out of space within the pennant, a breakout is due.
Bitcoin Price Chart: Daily Time Frame (March - September) (Chart 1)
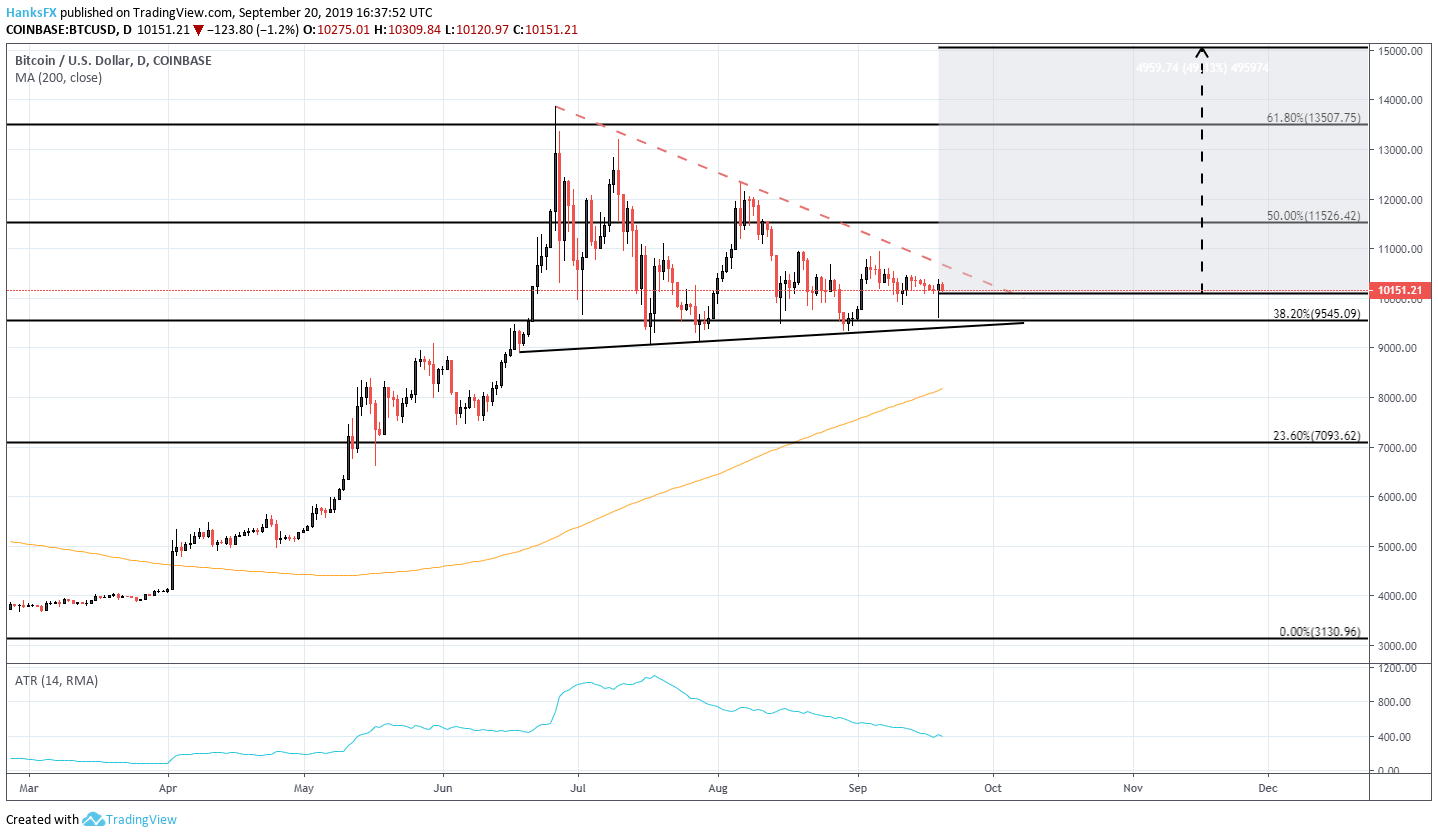
Chart created with TradingView by Peter Hanks
Typically, pennants are viewed to be bullish when the broader trend is bullish, and bearish when the broader trend is bearish. Given Bitcoin’s performance in the year to date and in the lead up to the pennant’s formation, the technical pattern could suggest a breakout higher is likely. Occasionally, the pattern offers insight on the size of the subsequent breakout. Looking to the formation’s height, the origination of the lower bound around $8,915 and the upper bound near $13,860 suggests a move of nearly $5,000 could be in the cards. That said, chart formations rarely play out like they do in the textbooks.
To that end, a fundamental catalyst - or lack thereof - could see the seemingly bullish formation turn into a bearish one. In my opinion, however, the willingness of bulls to push the coin higher in the year to date suggests the next move is likely higher. Thus, areas of interest exist around $11,525, a level that may pose initial resistance and $13,500 which roughly coincides with June’s high and the 61.8% Fibonacci level.
If, on the other hand, the pennant pattern delivers a bearish break lower, BTCUSD may look for support at the 200-day moving average which currently resides slightly above $8,000 with secondary support around the $7,100 level where the 23.6% Fib level rests. While Bitcoin awaits a break from its confined price range and crypto traders await the return of volatility, follow @PeterHanksFX on Twitter for further updates and analysis.
--Written by Peter Hanks, Junior Analyst for DailyFX.com
Contact and follow Peter on Twitter @PeterHanksFX
Read more: Dow Jones Forecast: Momentum Stocks Gain Ground but Resistance Weighs Heavy


