


US DOLLAR CURRENCY VOLATILITY: EURUSD SET TO SWING ON ECB RATE DECISION, US INFLATION
- US Dollar price action is set to heat up next week with EURUSD in the spotlight ahead of the September ECB meeting and US inflation report
- The DXY Index may respond less to USD-driven influences with the Federal Reserve blackout period in effect
- Join DailyFX analysts for Live Webinar Coverage of major data releases and trading strategies hosted regularly throughout the week
Our weekly US Dollar Technical Outlook succumbed to fundamental headwinds stemming from uninspiring data prints on America’s economy. Lackluster US Dollar price action throughout the week can also be largely attributed to spot GBPUSD surging on upbeat Brexit developments as well as a rebound in spot EURUSD driven by commentary from ECB officials. EURUSD and GBPUSD respectfully comprise 57.6% and 11.9% of the DXY Index – a popular basket of USD currency pairs.
DXY INDEX – US DOLLAR PRICE CHART: DAILY TIME FRAME (MARCH 15, 2019 TO SEPTEMBER 06, 2019)
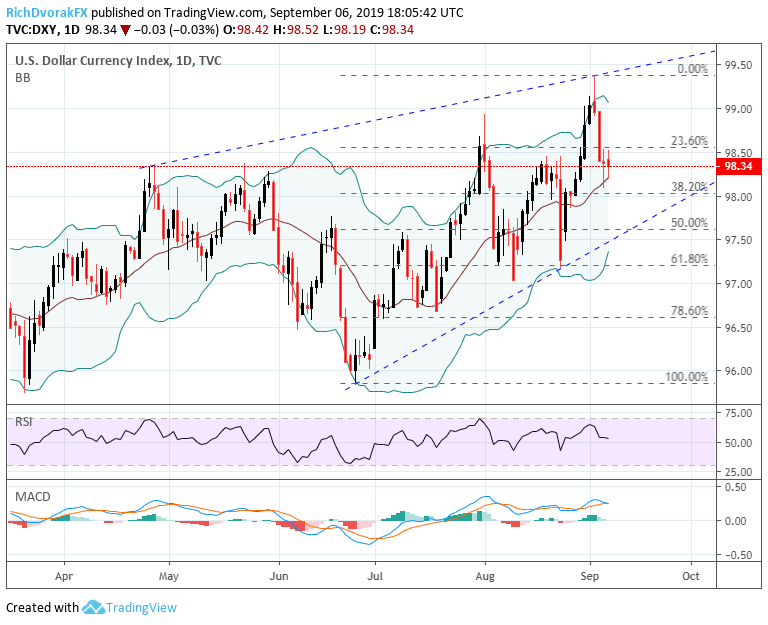
Chart created by @RichDvorakFX with TradingView
Looking ahead, the DXY US Dollar Index still has potential to forge a bullish reversal back toward its highest level since May 2017 from a technical perspective, which we pointed out in Thursday’s US Dollar volatility report. USD price action has so far found support from its upward sloping 20-day simple moving average slightly above the 98.00 handle. This area of technical confluence is highlighted by the 38.2% Fibonacci retracement of the US Dollar’s steady ascent from its June 25 low to September 03 high.
If selling pressure continues throughout next week, however, the DXY Index may look to its 50-day simple moving average which rests around the mid-point of its aforementioned bullish leg. Aside from US Dollar technicals, it is worth noting the sizable impact that Wednesday’s European Central Bank (ECB) interest rate decision stands to have on the DXY Index considering the basket is weighted heavy to EURUSD. Also, a slew of economic indicators will be released on the US economy which have potential to weigh on rate traders’ expectations for additional monetary policy accommodation from the Federal Reserve.
US DOLLAR – FOREX ECONOMIC CALENDAR

While the US Dollar forex economic calendar is jam-packed with data releases scheduled for next week, markets will likely place more credence on the US consumer price index (CPI) report set to cross the wires Thursday at 12:30 GMT. Although US retail sales and consumer sentiment present high-impact event risk and may spark US Dollar price action, the Federal Reserve stands to place heavier weight on inflation readings seeing that price stability is one of the central bank’s stated dual mandates. As such, the August CPI report is anticipated to overshadow Fed monetary policy expectations.
US DOLLAR 1-WEEK IMPLIED VOLATILITY & TRADING RANGES
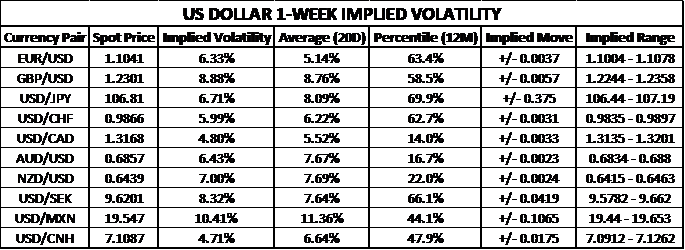
As previously mentioned, the September ECB meeting will more likely than not impact the US Dollar and DXY Index. In light of major event risk surrounding a central bank interest rate decision and updated monetary policy outlook, it is to be expected that implied volatility should tick higher as uncertainty builds and speculation swirls around what might actually unfold. That said, EURUSD 1-week implied volatility of 6.33% fits our assumption considering it is above the 20-day average reading of 5.14% and falls in the top 60th percentile over the last 12-months.
On the opposite side of the spectrum, US Dollar implied volatility for the week ahead is considerably muted for USDCAD and AUDUSD. This could be attributed to the September BOC meeting now in the rearview mirror and positive US-China trade war developments crushing volatility measures more broadly.
EURUSD – IG CLIENT SENTIMENT INDEX PRICE CHART: DAILY TIME FRAME (MARCH 11, 2019 TO SEPTEMBER 06, 201910)

On another note, the latest IG Client Sentiment data on spot EURUSD indicates that 60.9% of retail traders are net-long resulting in a long-to-short ratio of 1.56 to 1. Also, the number of traders net-long is 18.1% lower while the number of traders net-shorts is 45.4% higher compared to last week’s figures. Although we typically hold a contrarian view on crowd sentiment, the recent changes in client positioning suggests that spot EURUSD may soon reverse higher despite traders remain net-long.
-- Written by Rich Dvorak, Junior Analyst for DailyFX.com
Connect with @RichDvorakFX on Twitter for real-time market insight


