


AUDUSD: AUSTRALIAN DOLLAR LOOKS RIPE FOR MAJOR TECHNICAL BREAK
- AUDUSD has struggled to reclaim major technical confluence around the 0.68 price level
- Australian Dollar downside could accelerate as US-China trade war uncertainty lingers
- Find out if you possess the Top Traits of Successful Traders
Spot AUDUSD has sunk over 6% from its year-to-date high of 0.7295 printed back in January and selling pressure appears set to continue. The Australian Dollar has stumbled largely owing to US-China trade war fallout which is a theme that will likely continue for the foreseeable future. Also, broad-based US Dollar strength driven by safe-haven demand amid slowing global GDP growth and flashing recession signals exacerbated downside in spot AUDUSD.
AUDUSD PRICE CHART: MONTHLY TIME FRAME (MARCH 2008 TO AUGUST 2019)
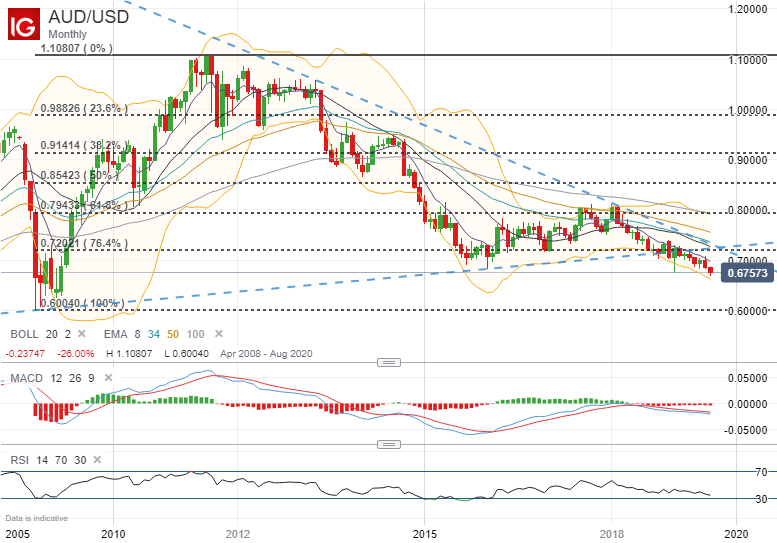
Spot AUDUSD has been on a steady decline since upward momentum ran out of steam at the 1.1000 price level back in 2011. Although AUDUSD briefly recovered from January 2016 to January 2018, which allowed the currency pair to form a longer-term uptrend extended from its October 2008 swing low, selling picked back up after dipping below technical support from its bullish trendline and 76.4% Fibonacci retracement highlighted in the chart above. Since then, the persistent drift downward has pushed spot AUDUSD back to its lowest level since the Great Financial Crisis over a decade ago.
AUDUSD PRICE CHART: DAILY TIME FRAME (DECEMBER 31, 2018 TO AUGUST 22, 2019)
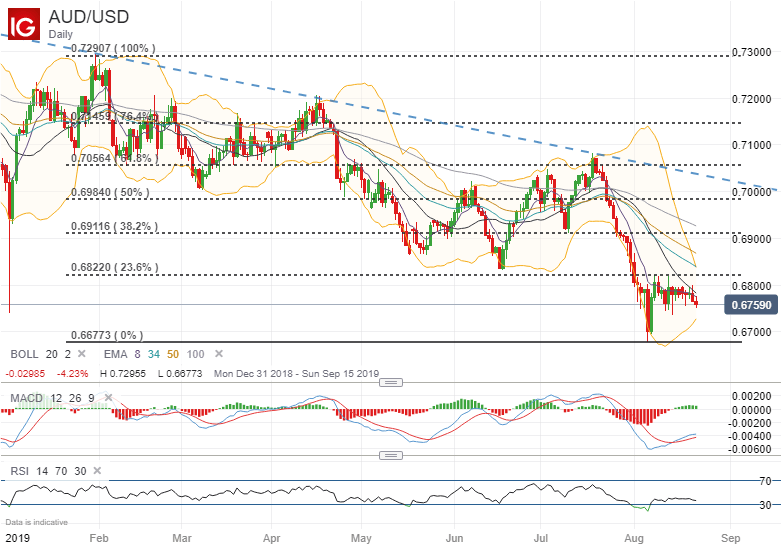
Battered by negative externalities from the US-China Trade War, spot AUDUSD continues to struggle to catch bid as uncertainty surrounding Sino-American trade relations lingers. Even with the prospect of a dovish Federal Reserve capitulating to the market’s lofty interest rate cut expectations, price action keeps getting strong-armed lower. That said, if spot AUDUSD price action fails to reclaim the 0.6800 handle soon, the currency pair stands to continue – and possibly steepen – its overarching downtrend.
AUDUSD PRICE CHART: 4-HOUR TIME FRAME (JULY 28, 2019 TO AUGUST 22, 2019)
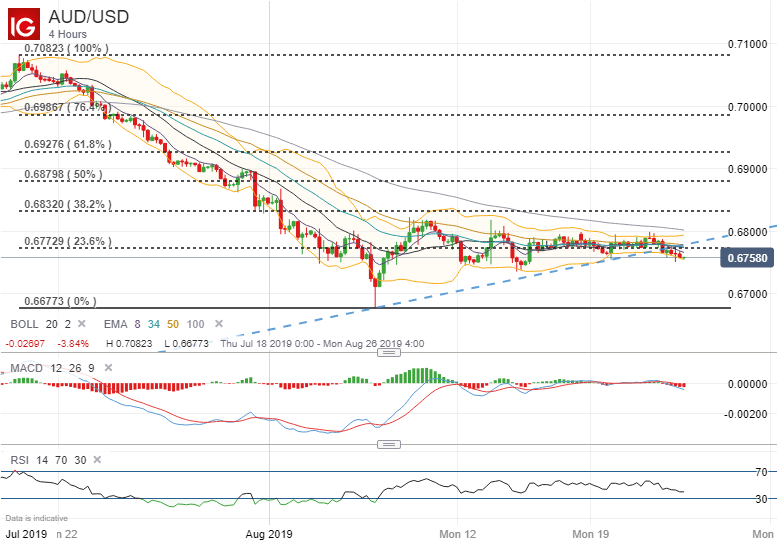
The struggle to eclipse 0.6800 becomes more apparent when honing in on a closer time frame. AUDUSD weakness endures even despite better than expected Australian jobs data and less-dovish than expected outlook from the Reserve Bank of Australia (RBA) in addition to US President Trump taking his additional tariff threat on Chinese goods off the table for now. As such, spot AUDUSD may quickly sink to retest its 2019 low if major technical confluence around the current price level gives way – particularly with bearish fundamental headwinds surrounding trade war risk and Fed monetary policy.
-- Written by Rich Dvorak, Junior Analyst for DailyFX.com
Connect with @RichDvorakFX on Twitter for real-time market insight


