AUSTRALIAN DOLLAR, AUDUSD IMPLIED VOLATILITY, AUGUST RBA MINUTES – TALKING POINTS
- The Australian Dollar will likely shift its focus to Tuesday’s release of the August RBA minutes
- AUDUSD overnight implied volatility of 7.07% is below its 12-month average
- Check out this Forex Trading for Beginners educational guide covering all the basics
Ahead of the August RBA minutes release, Australian Dollar overnight implied volatility measures ticked higher across the board but appear relatively muted in comparison to average readings over the last 12 months. While the publication will certainly reveal details of the central bank’s latest monetary policy decision and appetite for further accommodation, low Australian Dollar overnight implied volatility readings might suggest that the August RBA minutes may lack market-moving potential.
AUSTRALIAN DOLLAR OVERNIGHT IMPLIED VOLATILITY & TRADING RANGES

Yet, EURAUD overnight implied volatility of 6.47% stands out as particularly low in light of Tuesday’s political risk surrounding Italy’s no-confidence vote against Prime Minister Guiseppe Conte led by Deputy Prime Minister Matteo Salvini.
AUSTRALIA ECONOMIC SURPRISE INDEX – CITI
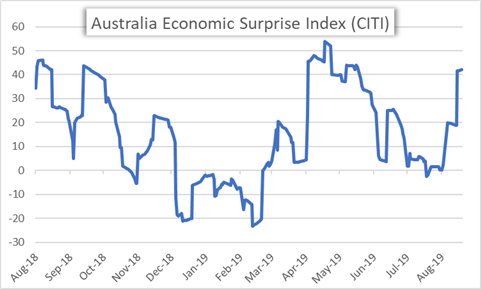
Since the August RBA meeting where the central bank left its policy interest rate unchanged at 1.00% after cutting by 25-basis points in both June and July, the Australian Dollar’s fundamental backdrop turned a bit rosier. This has been driven largely by the positive US-China trade war developments following Trump’s tariff delay in addition to the blockbuster Australian jobs report that crossed the wires last week.
RESERVE BANK OF AUSTRALIA INTEREST RATE CHANGE PROBABILITIES – SEPTEMBER 2019
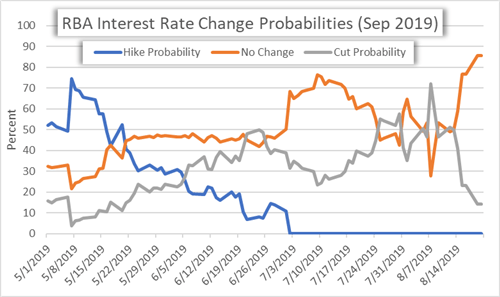
Unsurprisingly, the apparent deceleration in trade tensions between the US and China combined with better-than-expected economic data out of Australia have sent traders unwinding RBA rate cut bets for its September meeting. In fact, the probability of a September RBA meeting rate cut has plunged from 72% on August 7 to 14.4% today. That said, the Australian Dollar still stands to be impacted by the August RBA minutes depending on the relatively hawkish or dovish tone communicated regarding monetary policy outlook – particularly the central bank’s openness to cut interest rates further to combat excess labour market slack and lingering trade war uncertainty.
AUDUSD PRICE CHART: DAILY TIME FRAME (JANUARY 11, 2019 TO AUGUST 19, 2019)
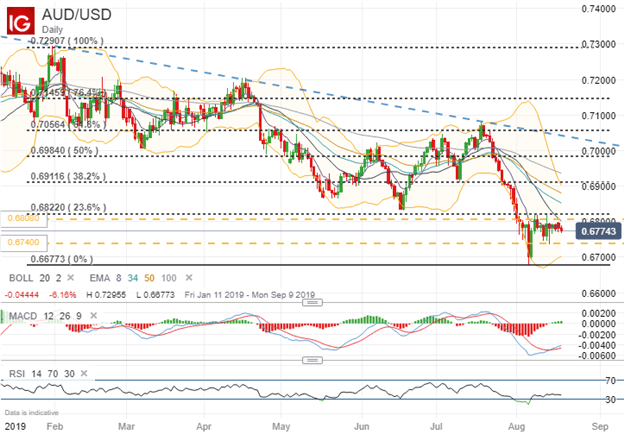
AUDUSD overnight implied volatility of 7.07% can be used to calculate the currency pair’s 1-standard deviation trading range of 0.6740-0.6808. Despite the Aussie’s positive fundamental developments over the last week, spot AUDUSD has struggled to reclaim the 0.6800 handle and remains a daunting level of technical resistance. Also, aside from the option-implied lower bound of 0.6740, last week’s low of 0.6736 could keep a lid on potential downside – particularly with USD traders likely sidelined ahead of Jackson Hole slated to kick off Wednesday.
After markets digest August RBA minutes, traders will turn to the Jackson Hole Symposium where RBA governor Lowe will be speaking alongside other global central bankers over the weekend. Also, Aussie PMI data on tap for release Wednesday could move the needle for Australian Dollar currency pairs. Until then, changes in IG Client Sentiment could provide insight on where AUDUSD might head next.
AUDUSD PRICE CHART: DAILY TIME FRAME (FEBRUARY 20, 2019 TO AUGUST 19, 2019)
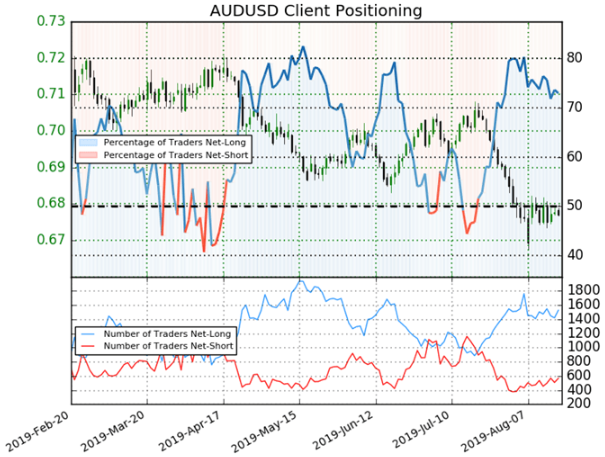
AUDUSD: Retail trader data shows 73.0% of traders are net-long with the ratio of traders long to short at 2.7 to 1. In fact, traders have remained net-long since Jul 19 when AUDUSD traded near 0.70411; price has moved 3.8% lower since then. The number of traders net-long is 4.9% higher than yesterday and 2.7% higher from last week, while the number of traders net-short is 6.2% higher than yesterday and 2.4% higher from last week.
We typically take a contrarian view to crowd sentiment, and the fact traders are net-long suggests AUDUSD prices may continue to fall. Positioning is less net-long than yesterday but more net-long from last week. The combination of current sentiment and recent changes gives us a further mixed AUDUSD trading bias.
-- Written by Rich Dvorak, Junior Analyst for DailyFX.com
Connect with @RichDvorakFX on Twitter for real-time market insight


