


Gold and Crude Oil Prices, Analysis and Charts:
Q3 2019 Goldand Oil Forecasts and Top Trading Opportunities
Gold Finally Breaks Through Resistance
After trading in a symmetrical triangle for the last couple of weeks, gold has finally broken higher just ahead of the FOMC rate decision later today. We have looked at this set-up recently and mentioned that an upside break was on the cards, but we felt that it was more likely to happen post-FOMC meet, when the rate decision and possible forward guidance was known. While the move is technically positive, it may be reversed post-FOMC if the Fed disappoints, so care is needed. If the move higher continues, gold is set-up to re-test the recent 6+ year high of $1,453/oz. made of July 18.
Live Coverage of the FOMC Rate Decision – Register Here.
The DailyFX Calendar covers all important market moving data releases and events.
Gold Price Daily Chart (January – July 30, 2019)
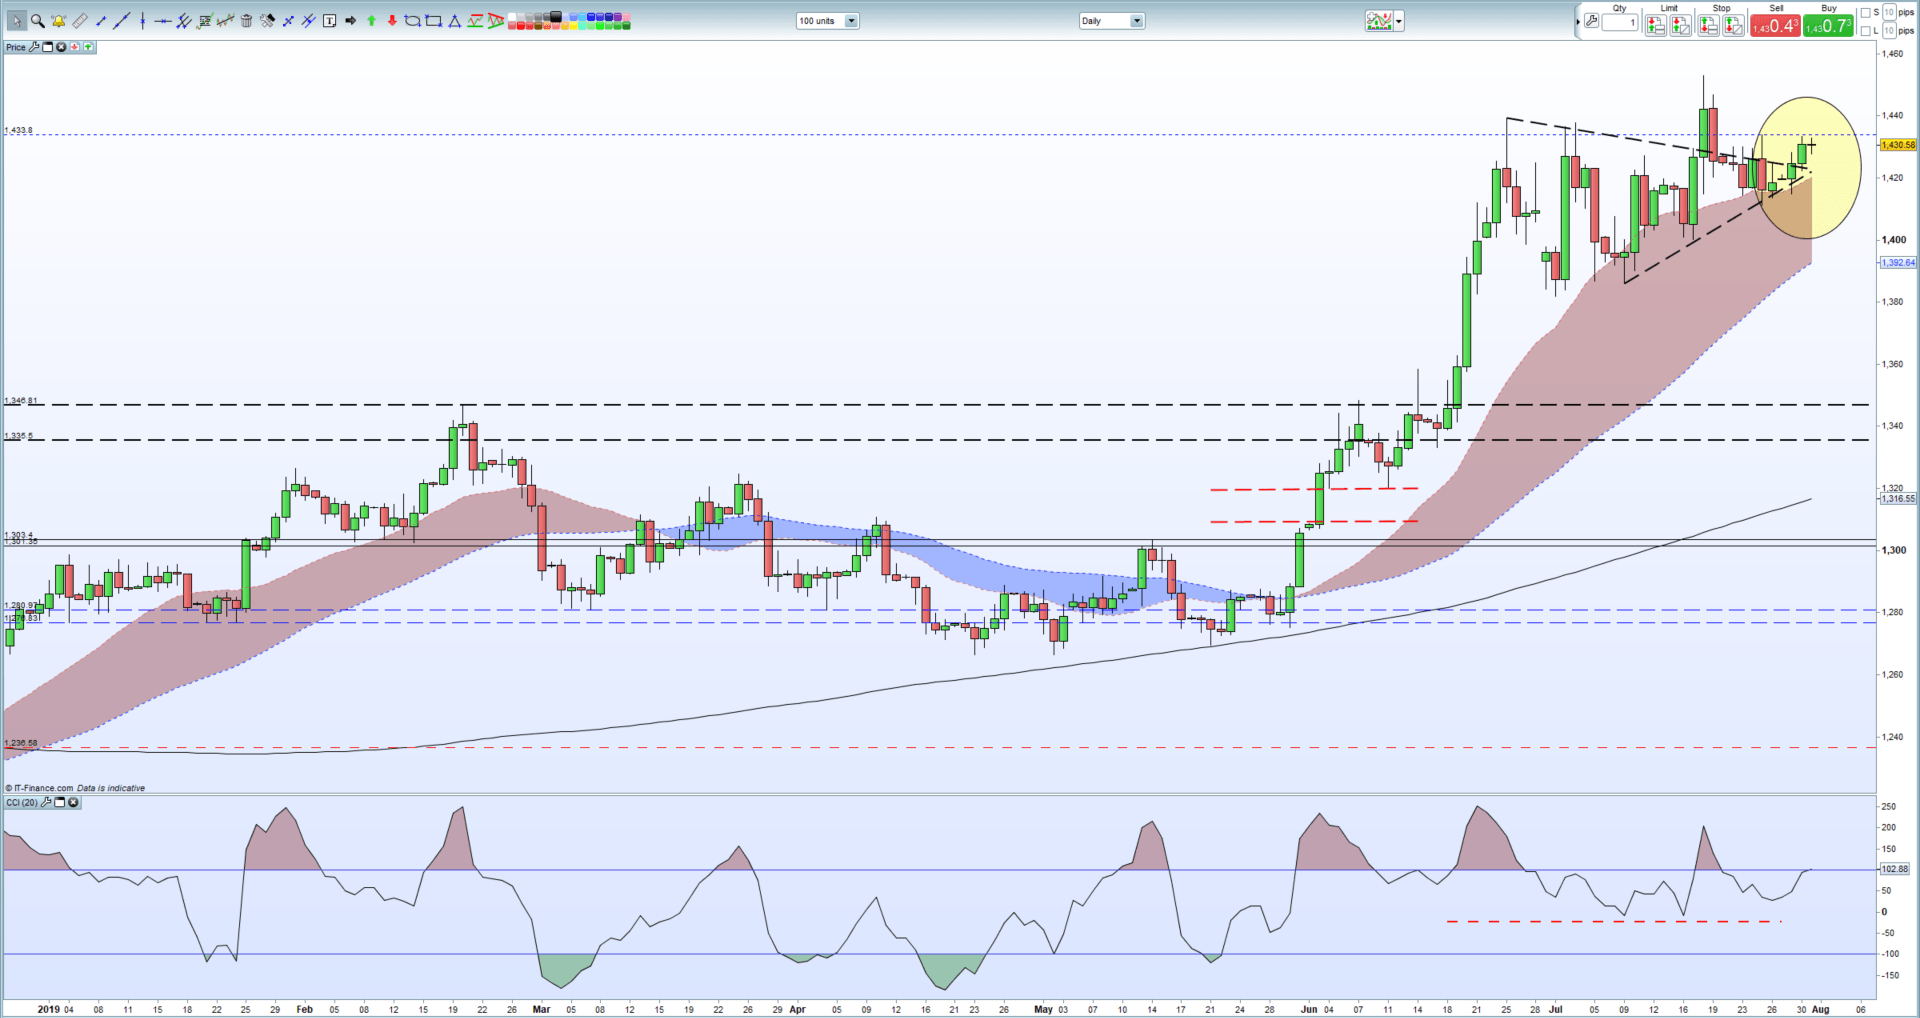
IG Client Sentiment data show that 67.9% of retail traders are net-long of gold, a bearish contrarian indicator. However, recent daily and weekly positional changes suggest that gold prices may move higher despite traders remaining net-long.
How to Trade Gold: Top Gold Trading Strategies and Tips
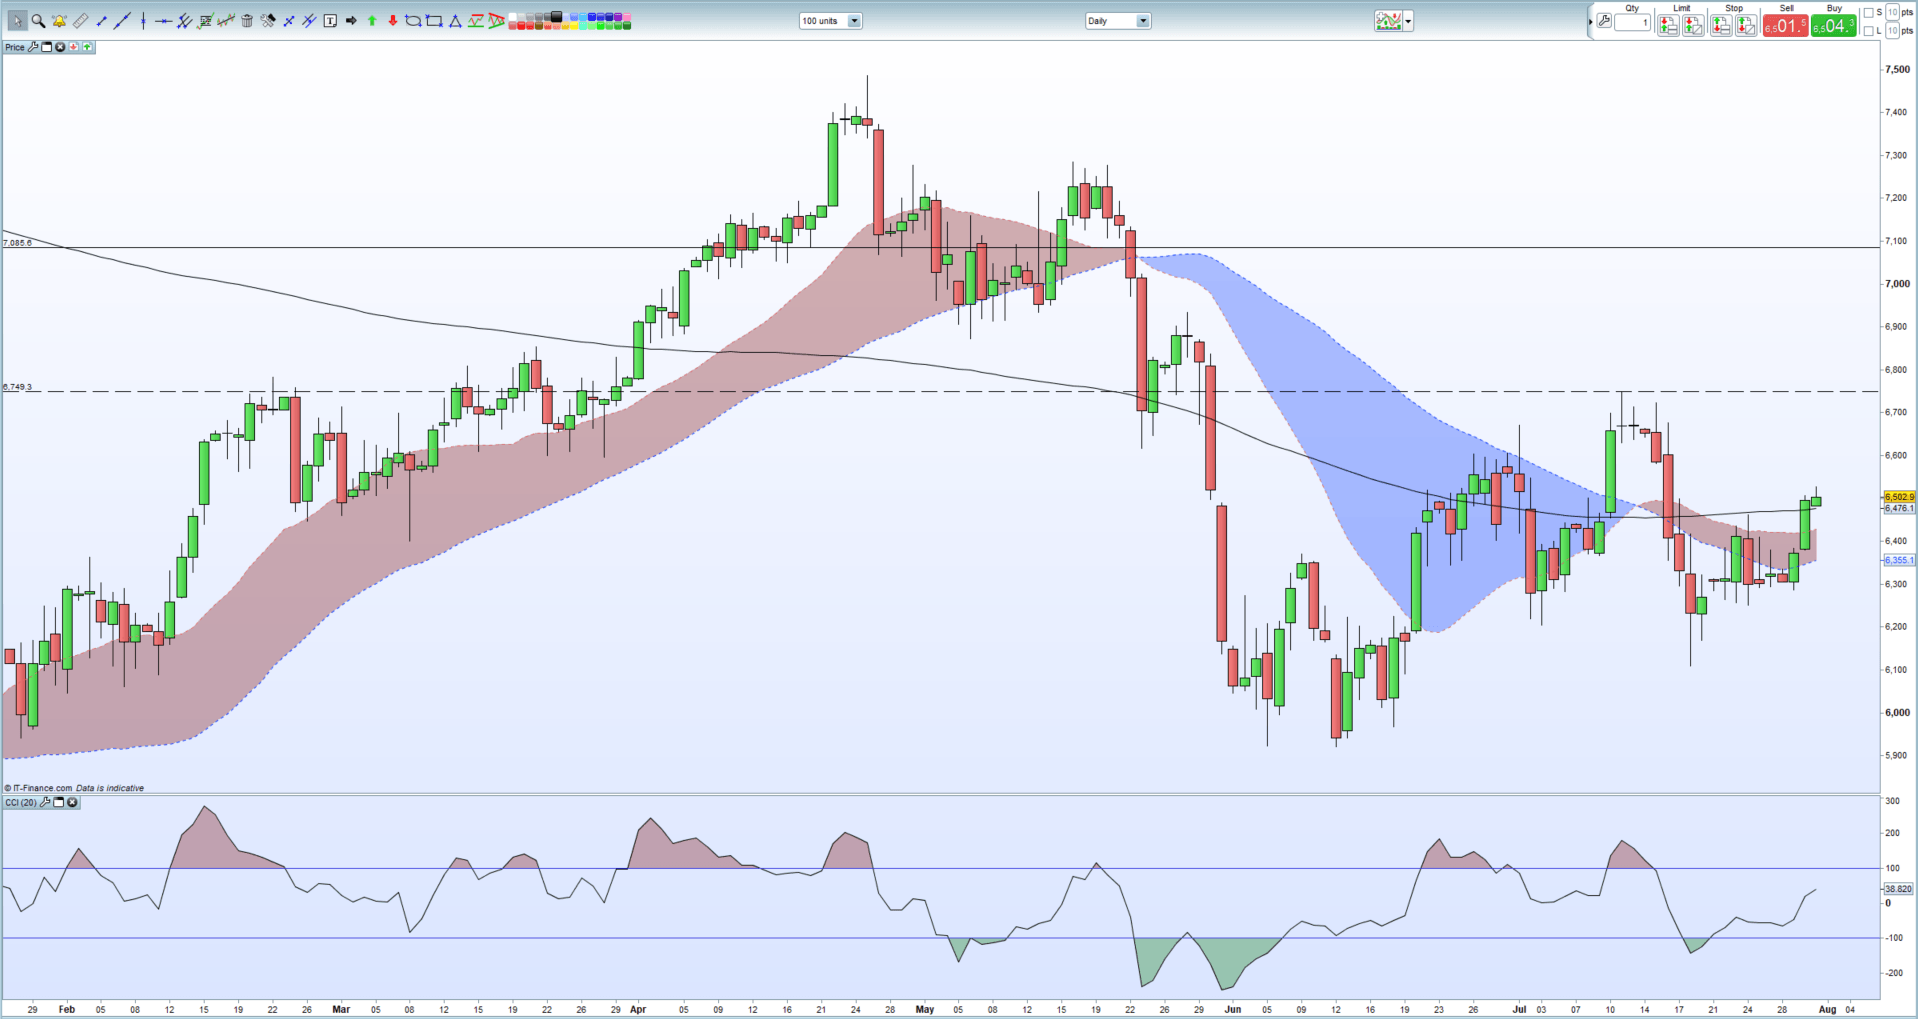
Crude Oil Breaks 200-Day Moving Average, US-China Fears Curb Move
Crude oil pushed higher late Tuesday after the latest API data showed a much larger-than-expected inventory drawdown, fueling expectations of a supportive DOE numbers later today. The move pushed crude oil back above the 200-day moving average, the first clean break for two weeks and opens the way for a rebound back to $65.80/bbl. before a re-test of the recent $67.50/bbl. high. Again, traders must be wary of the FOMC rate decision later today. While a 0.25% rate cut is fully priced in, both gold and oil may need the Fed to err on the dovish side to keep the commodity rally in place. If Fed chair Jerome Powell surprises with a 50-basis point cut, or comes out with a dovish forward guidance, gold and oil may reach their upside targets sooner rather than later.
200-Day Moving Average: What it is and How it Works.
Crude Oil Daily Price Chart (January – July 31, 2019)
Traders may be interested in two of our trading guides – Traits of Successful Traders and Top Trading Lessons – while technical analysts are likely to be interested in our latest Elliott Wave Guide.
What is your view on Gold and Oil – bullish or bearish?? You can let us know via the form at the end of this piece or you can contact the author at nicholas.cawley@ig.com or via Twitter @nickcawley1.


