


Bitcoin (BTC) Price Outlook, Chart and Analysis:
- Bitcoin needs to consolidate before the next push higher.
- The market remains oversold.
IG Client Sentiment Data shows how retail are positioned in a variety of cryptocurrencies. See how daily and weekly positioning can affect our trading bias. Bitcoin (BTC) trade data shows 80.1% of traders are net-long, a strong contrarian bearish signal. However, recent daily and weekly changes in sentiment give us a mixed Bitcoin trading bias.
A Guide to Day Trading Bitcoin and Other Cryptocurrencies.
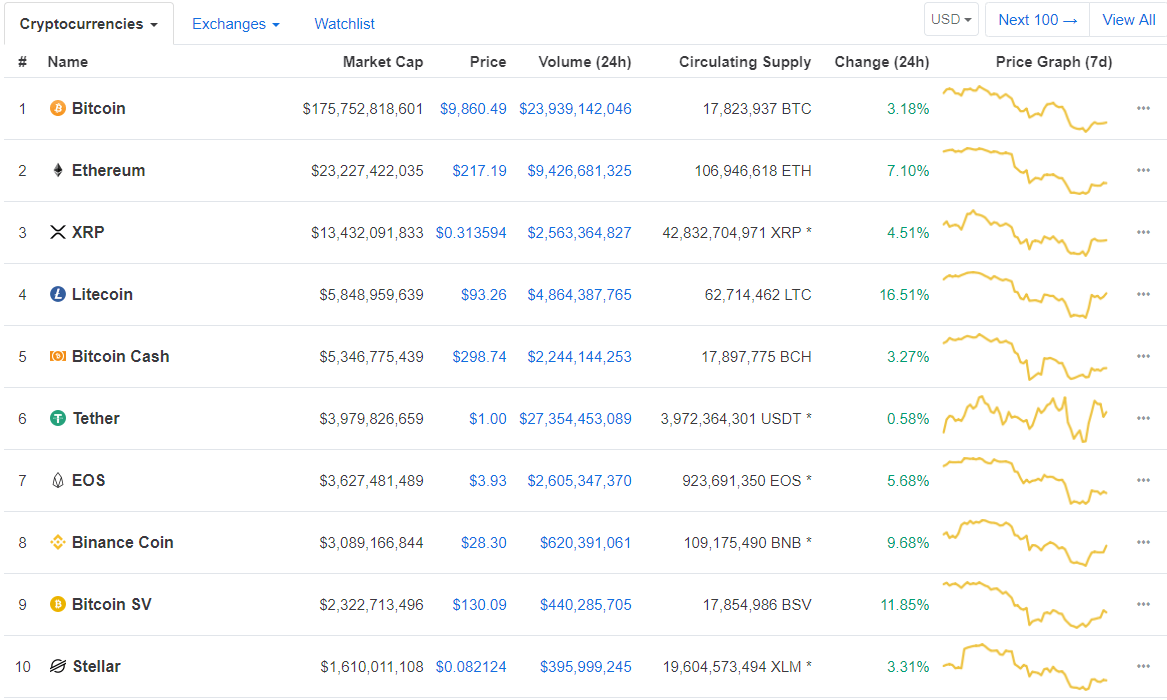
A sea of green in the cryptocurrency market Thursday with some alt-coins showing double-digit gains over the last 24 hours, erasing in part some of this week’s heavy losses. The sell-off, prompted in part by stories of a ‘fat Tether finger’ and the grilling US lawmakers gave Facebook executives over their proposed stable coin Libra, saw BTC lose $2,000 in one day, stopping just above $9,000.
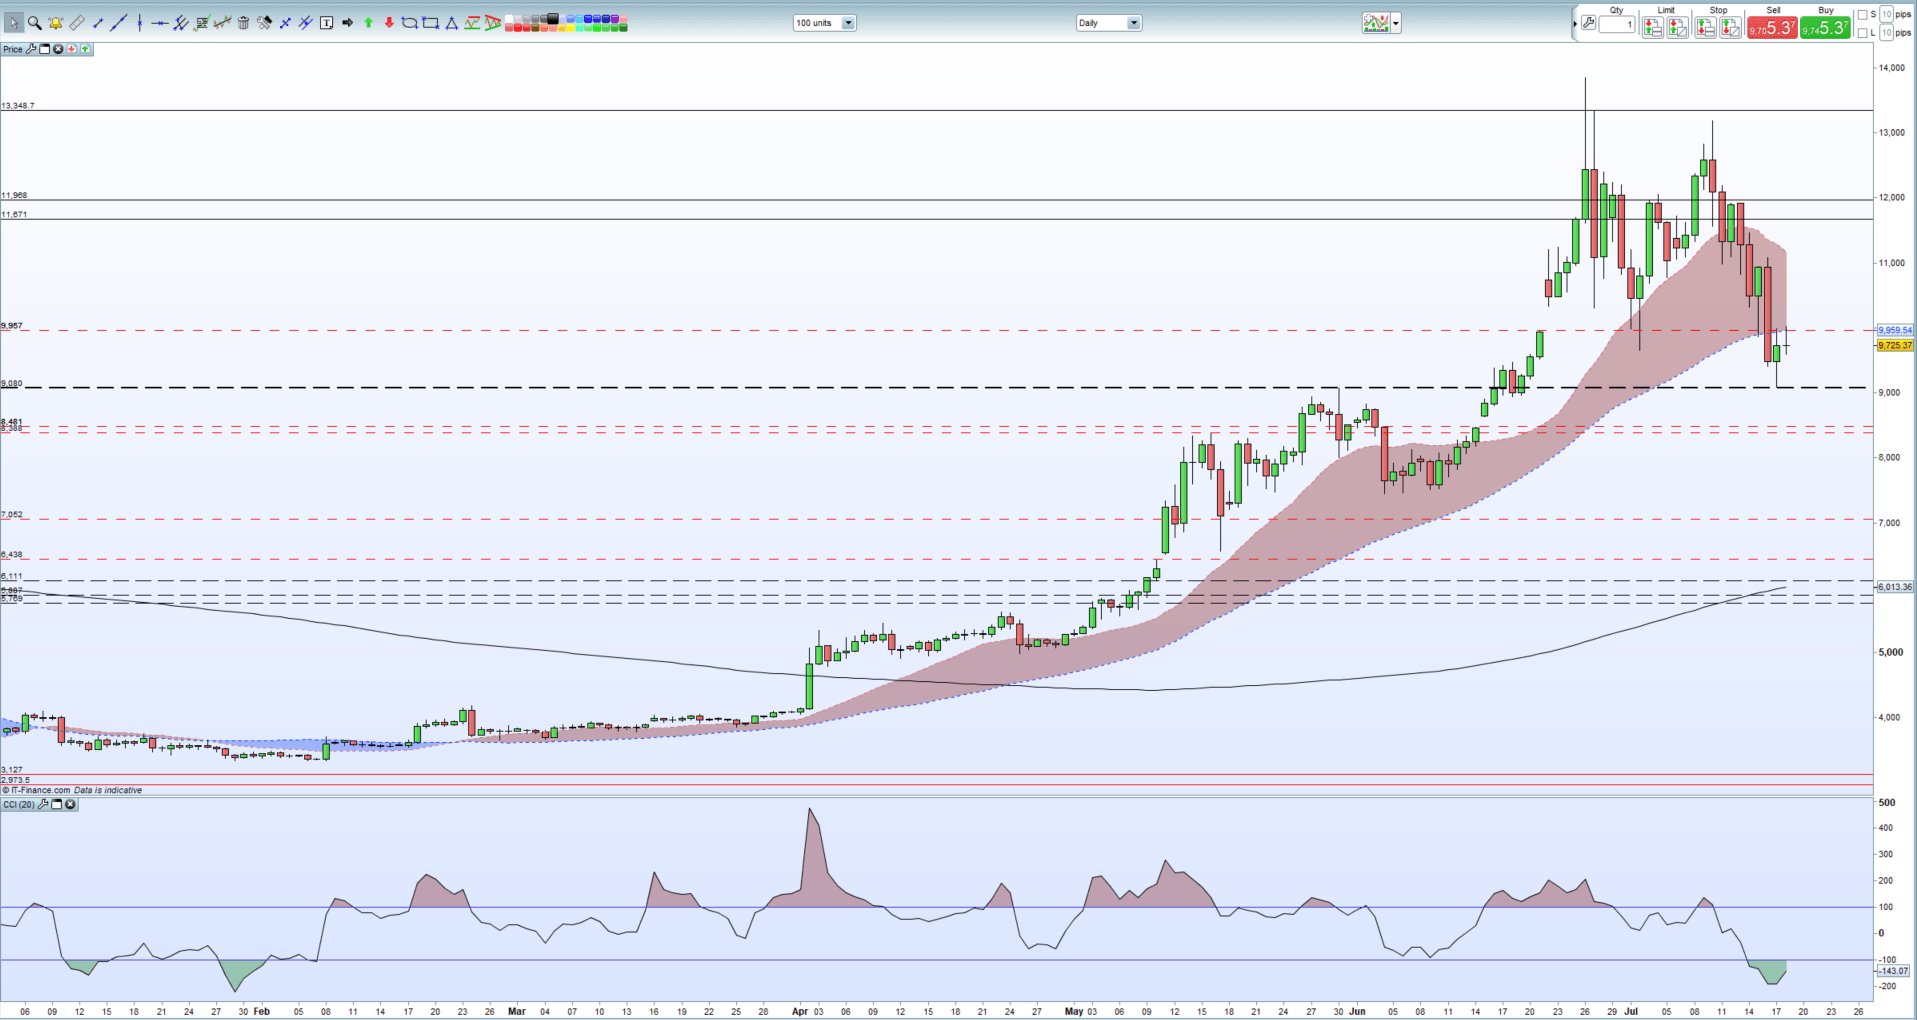
A look at the daily BTC chart shows initial support around $9,080 held firm in the face of the sell-off, providing a springboard for the latest move higher. While this level, and the psychological $9,000 level just below may hold, stronger support is seen lower down around $8,400 before much stronger support from a cluster of recent lows around $7,500 come into play.
To the upside, Tuesday’s bear candle provides scope for a move back to $10,000 and then through a cluster of recent lows all the way back to $11,00. The CCI indicator continues to show that Bitcoin is oversold, and this may underpin any move higher in the coming days.
Bitcoin (BTC) Daily Price Chart (January – July 18, 2019)
Traders may be interested in two of our trading guides – Traits of Successful Traders and Top Trading Lessons – while technical analysts are likely to be interested in our latest Elliott Wave Guide.
What is your view on Bitcoin (BTC) – bullish or bearish?? You can let us know via the form at the end of this piece or you can contact the author at nicholas.cawley@ig.com or via Twitter @nickcawley1.


