


Dow Jones, S&P 500, Nasdaq 100 Price Outlook:
- The Dow Jones will look to hold above 25,200 if it is to stave off deeper declines
- Similarly, the S&P 500 will have to hold above 2,800
- Retail traders are overwhelmingly short the S&P 500, find out how to use IG Client Sentiment Data with one of our Live Sentiment Data Walkthroughs
Dow Jones, S&P 500, Nasdaq 100 Price Outlooks for the Week Ahead
The Dow Jones enjoyed a gap higher Tuesday morning, a reassuring sign for equity bulls who have found themselves on the backfoot in the month of May. That said, optimism was short-lived as bears looked to regain control after running into topside resistance around 25,710. The trendline originates from the highs on May 1 and is particularly steep. Should bears look to keep the Dow Jones beneath it, further selling pressure will be needed as the Index quickly runs out of space.
Dow Jones Price Chart: 1 – Hour Time Frame (February – May 2019) (Chart 1)
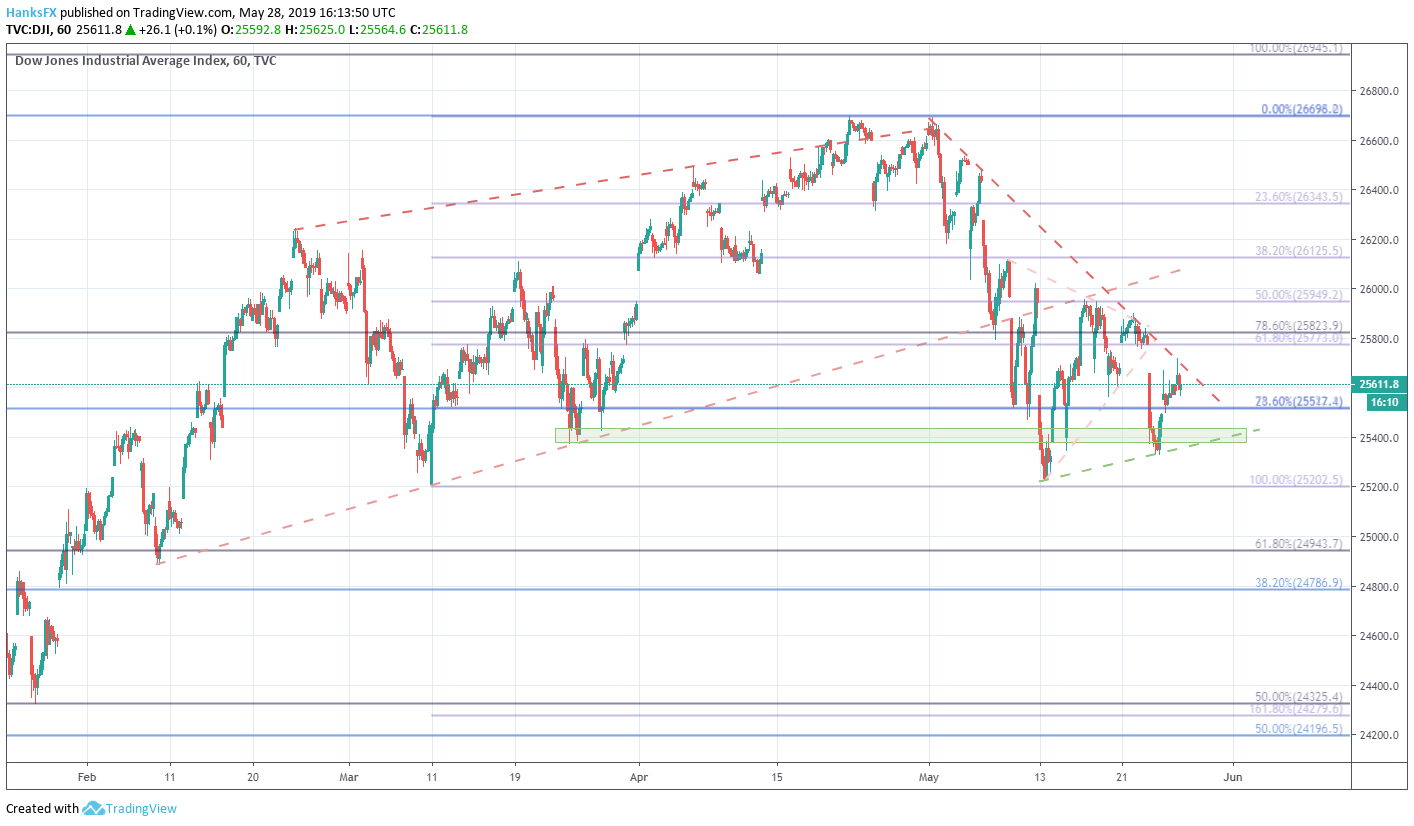
On the other hand, the Average enjoys multiple areas of support – with some offering more buoyancy than others. A confluence of Fibonacci levels around 25,520 has sparked price indecision in the past and will pose the first barrier to a move lower. Beyond that, a range of support marked by the swing-low in late March will meet the beginnings of a trendline from the lows etched in May. Should that area of confluence fail to hold, the final line in the sand is marked by the lows of March around 25,200. A break beneath 25,200 would likely provide technical traders and sentiment-watchers the evidence to justify further selling.
S&P 500 Price Outlook
The S&P 500 faces similar technical patterns, negotiating steep topside resistance and a litany of support beneath. Resistance to be mindful of exists around 2,838, while initial support will be offered by the ascending trendline from the lows of March and May. However, the line’s price influence may be reduced following a break beneath last week.
S&P 500 Price Chart: 1 – Hour Time Frame (March – May 2019) (Chart 2)
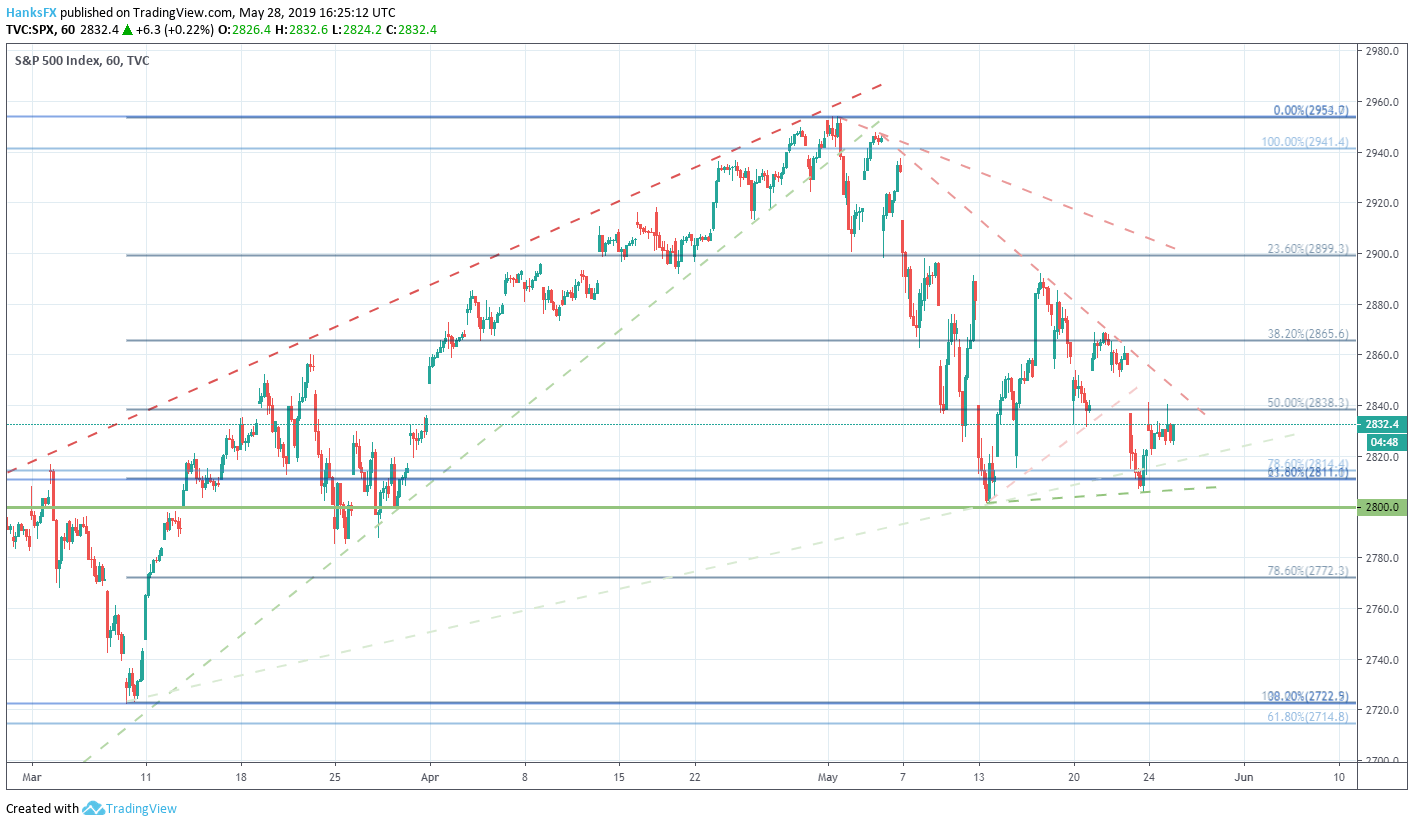
But that break has helped to produce another trendline – marked by the lows on May 13 and 23. That trendline, coupled with the two Fib levels, should provide considerable support in the 2,810 to 2,814 range. The final level to watch is 2,800. As with the Dow Jones, a break beneath this key level would open the door for deeper losses.
Nasdaq 100 Price Outlook
Unlike the Dow Jones and S&P 500, the Nasdaq faces considerable nearby resistance. Three Fib levels stand in the path to 7,400, which can only be tested after a break above the support-turned-resistance trendline around 7,366. The level stalled an early move higher in Tuesday trading, and will likely remain the first barrier to higher-highs.
Nasdaq 100 Price Chart: 1 – Hour Time Frame (May 2019) (Chart 3)
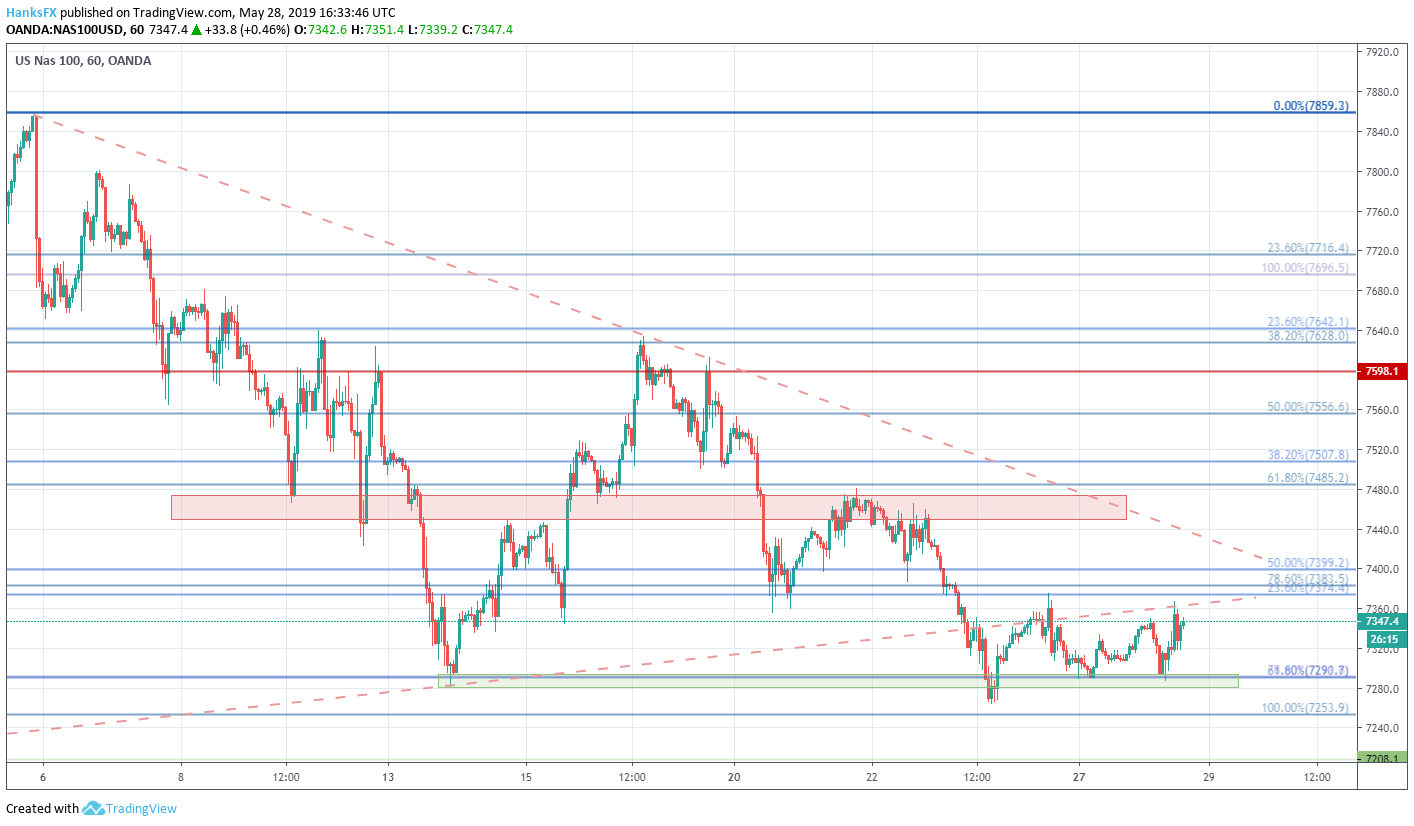
Beneath, the tech-heavy Index enjoys two Fib levels at 7,290. While each of the Fib levels in-play command varying degrees of respect, each has shown the ability to influence price over shorter time frames. With that in mind, stops and targets should be set accordingly. Over longer periods, traders should be wary of breaks of necessity like last Thursday, when the Dow Jones and S&P 500 fell out of their respective wedges.
The economic calendar for the week ahead is filled with important events as traders look to navigate fundamental themes – many of which could fuel another gap. Check out the weekly fundamental forecast for the Dow Jones, DAX 30, and FTSE 100 for deeper insight on the driving themes and follow @PeterHanksFX on Twitter for equity updates on Twitter.
--Written by Peter Hanks, Junior Analyst for DailyFX.com
Contact and follow Peter on Twitter @PeterHanksFX
Read more: Will the Stock Market Crash in 2019?
DailyFX forecasts on a variety of currencies such as the US Dollar or the Euro are available from the DailyFX Trading Guides page. If you’re looking to improve your trading approach, check out Traits of Successful Traders. And if you’re looking for an introductory primer to the Forex market, check out our New to FX Guide.


