


S&P 500 Outlook Talking Points:
- Equity traders are looking to the dot-plot and subsequent commentary from Chairman Powell to gauge the Fed’s policy stance moving forward
- A strengthened equity market and robust economic data could see Chairman Powell caught between a rock and a hard place
- Learn tips to trade breaking news with our Trade the News Trading Guide
S&P 500 Outlook: Index Sentiment, Financials Await Fed Rate Decision
Wednesday will see the announcement of the Federal Open Market Committee’s rate decision. While the policy meeting is very unlikely to result in an altered rate forecast, a recovering equity market and robust economic data could see some officials strike a more hawkish tone than in months prior. The landscape could force Chairman Powell to walk the line between tempering dovish expectations and dinging equity sentiment with a hawkish tone.
CME FedWatch Tool – Interest Rate Probabilities
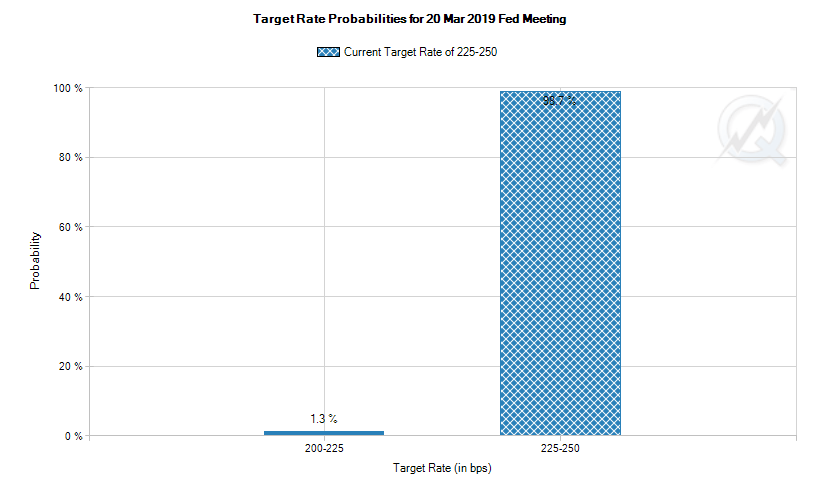
Source: CME
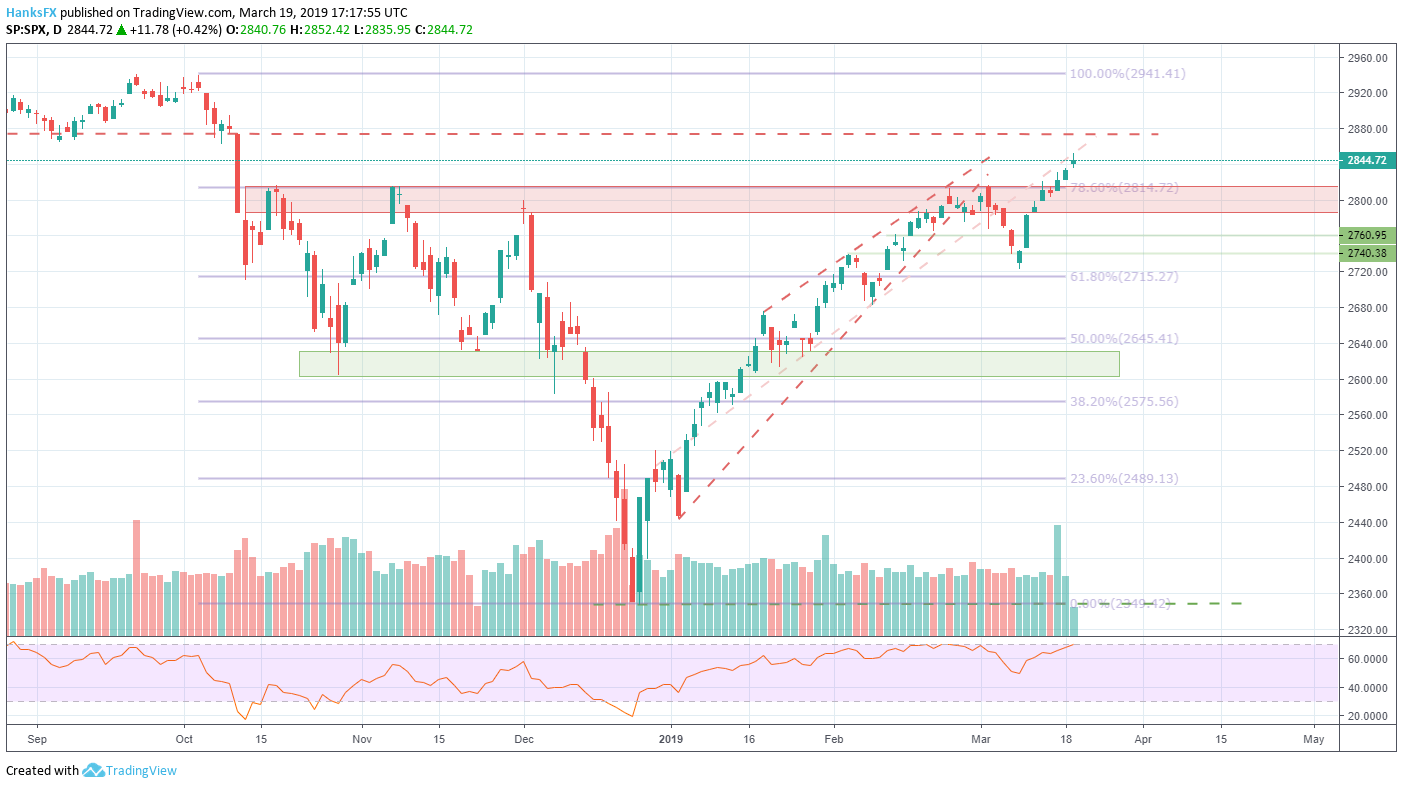
With the S&P 500’s recent break through four-month range resistance, the level should now act as support. Thus, a key level to watch in the event of a poor reaction will be 2,815. Subsequent support is less explicit but would likely exist near the bottom of the recent resistance band near 2,785. The Dow Jones finds itself in a less advantageous position but enjoys the benefit of a golden cross. However, given the fundamental implications of Wednesday’s FOMC decision, a surprise shift in policy could render technical levels obsolete.
S&P 500 Price Chart: Daily Time Frame (September 2018 – March 2019) (Chart 1)
Learn the differences between the Dow Jones and the S&P 500
The potentially drastic implications from a shift in policy could also shake-up sector performance. While high-growth sectors such as tech and semiconductors may fall under pressure in the event of more hawkish tone, more defensive industries may see relatively lower volatility as investors seek their relative safety. That said, utilities and healthcare have witnessed substantial demand in recent weeks with the former firmly in overbought territory.
Dow Jones Price Chart: Daily Time Frame (January 2018 – March 2019) (Chart 2)
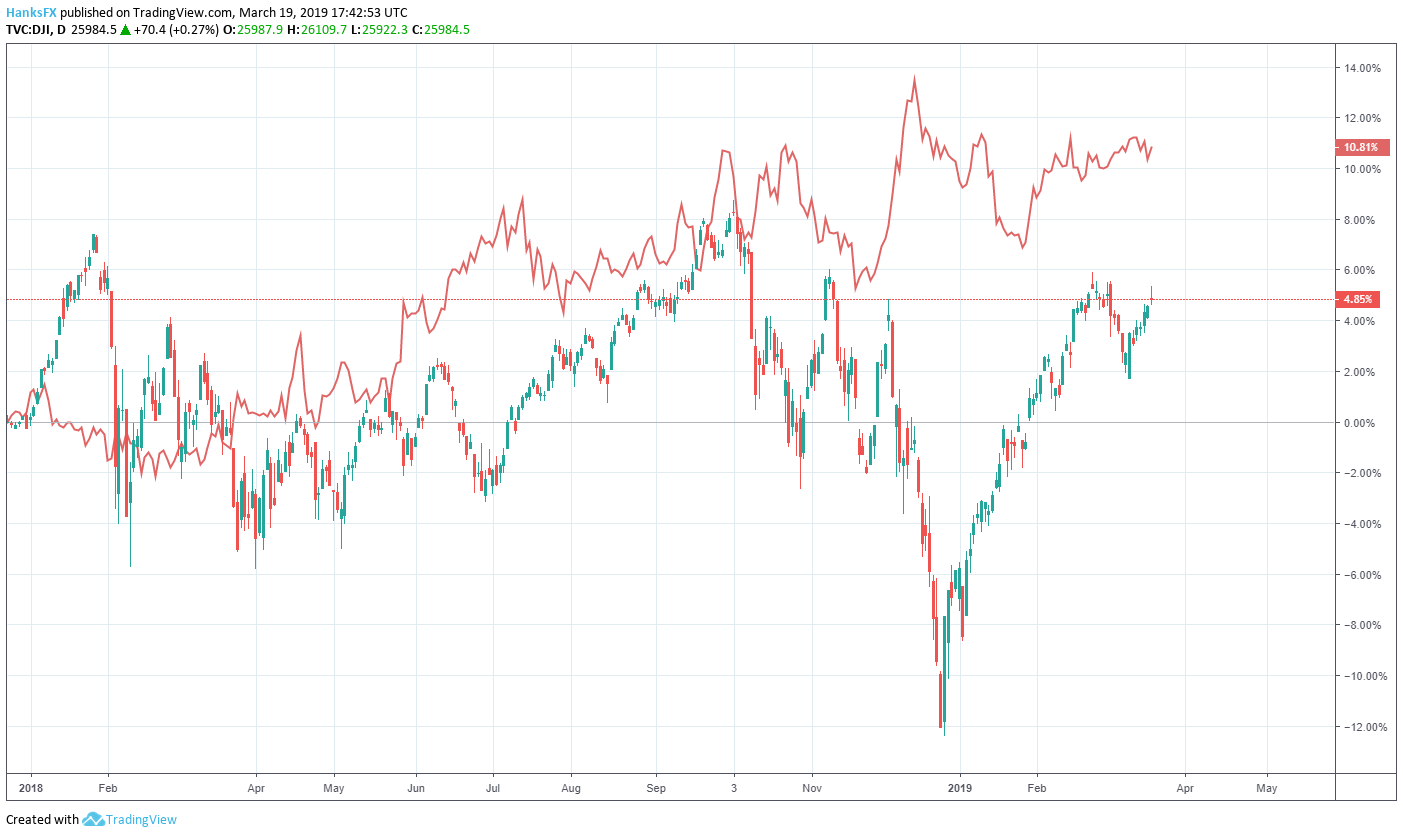
Dow Jones price chart overlaid with ratio of SPX to XLF in red
On the other hand, financials could find themselves in a unique position, enjoying some benefits from hawkish policy (owing to the connection between revenue and market rates) and riding the wave of broader equity sentiment in the eventuality of a dovish continuation. The XLF exchange traded fund – a fund that offers exposure to US financial stocks - has underperformed the S&P 500 in the last year, with particular weakness from early December 2018 when the dovish tone was first struck.
View our Economic Calendar for big events scheduled in the week ahead.
In the scenario where Chairman Powell suggests rate hikes may return to the table sooner than anticipated, XLF and the financial sector may see increased volatility and perhaps a return to parity. In any event, the monetary policy meeting is likely to spur price action across a litany of asset classes. For live coverage of the rate decision, join John Kicklighter on Wednesday at 1:45 EST.
--Written by Peter Hanks, Junior Analyst for DailyFX.com
Contact and follow Peter on Twitter @PeterHanksFX
Read more: Dow Jones, S&P 500, FTSE 100 and DAX 30 Fundamental Forecast
DailyFX forecasts on a variety of currencies such as the US Dollar or the Euro are available from the DailyFX Trading Guides page. If you’re looking to improve your trading approach, check out Traits of Successful Traders. And if you’re looking for an introductory primer to the Forex market, check out our New to FX Guide.


