


S&P 500 Outlook Talking Points:
- The S&P 500 will attempt to breakthrough the 2815 level as a key Brexit vote unfolds
- Meanwhile, the Dow Jones remains comparatively troubled with Boeing to blame
- Learn the differences between the Dow Jones and the S&P 500
S&P 500 Outlook: Index Fights Resistance, US Grounds Boeing 737 Max Models
The S&P 500 probed a key technical level in Wednesday’s trading as bulls look to notch a close above the 2815 to 2817 range. A close comfortably above 2815 could open the door for a continuation higher. Elsewhere, the Dow Jones remains a laggard this week with Boeing to blame.
S&P 500 Price Chart: 4 – Hour Time Frame (October 2018 – March 2019) (Chart 1)

The world’s largest airplane-maker has now had two-thirds of its 737 Max models grounded - as of this morning. As of the afternoon, US President Donald Trump followed the lead of many other countries and announced officially that he was grounding the united States' fleet of that model plane, sending Boeing's shares even lower. Of the major developed economies, only Japan continues to operate the plane. Boeing's underperformance continues to contribute heavily to the price divergence between the S&P 500 and the Dow Jones.
Dow Jones Price Chart: 5 – Minute Time Frame (March 11 – March 13) (Chart 2)
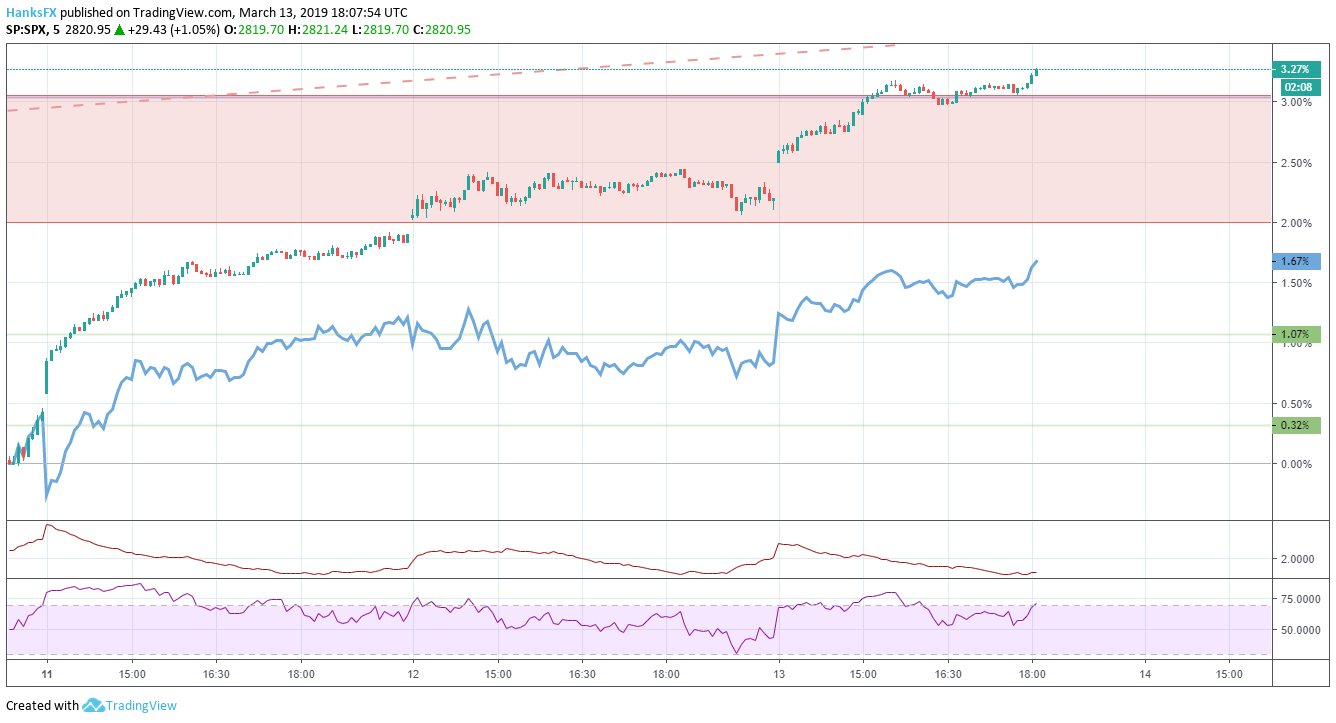
However, other stocks have also mounted considerable changes this week thereby contributing to the divergence. On Monday, Apple and Nvidia were accountable for a large portion of the S&P 500’s stellar performance. As the week progressed, S&P 500 components have continued their broader outperformance with the percentage of stocks in the S&P 500 above their 5-day moving average climbing versus the percentage of Dow components above their 5-day moving average.
S&P 500 Price Chart: Daily Time – Frame (August 2018 – March 2019) (Chart 3)
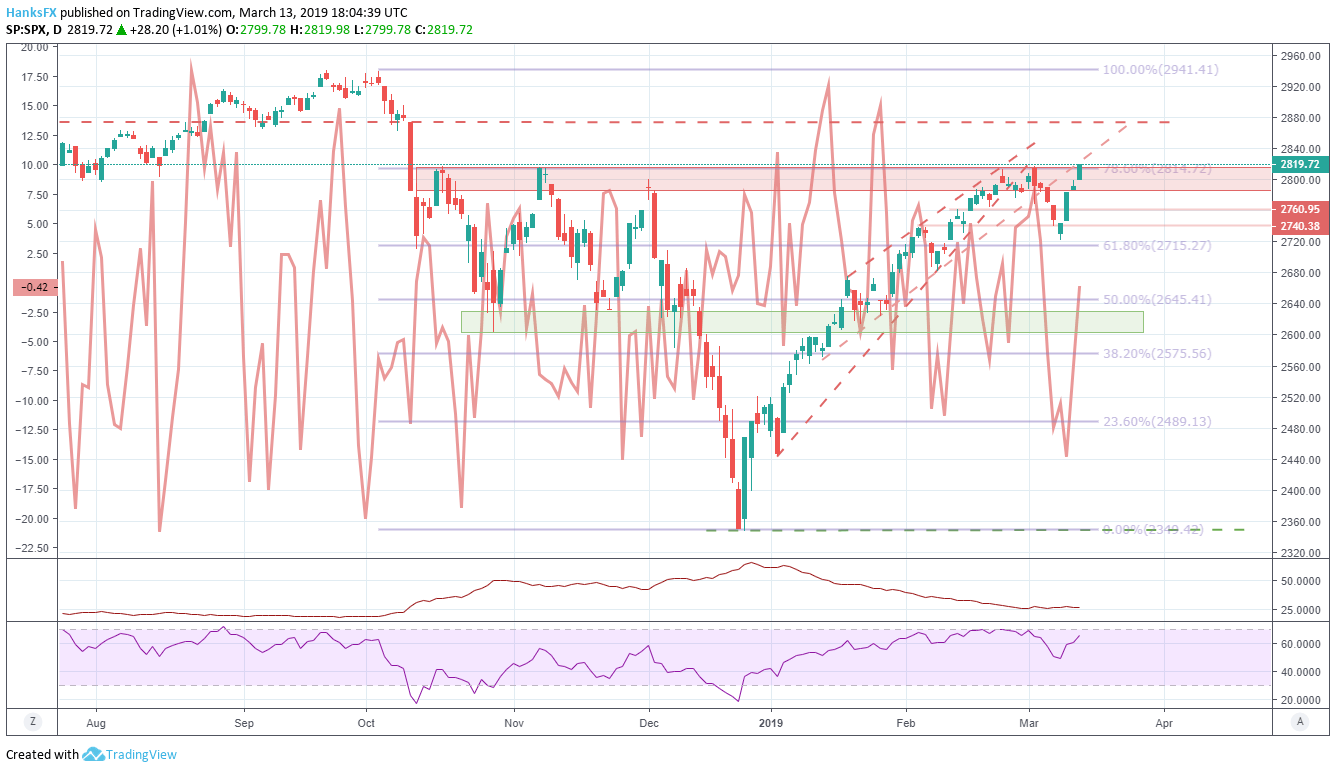
Difference between % of S&P 500 stocks above 5DMA and % of Dow Jones stocks above 5DMA in red
While single-stock components appear largely to blame this week, the make-up of the indices is also to blame. The S&P 500’s exposure to higher-growth components allows it to frequently outpace the blue-chip-based Dow Jones on positive days. Conversely, the blue-chip index often outperforms the S&P 500 on more “risk-off” trading sessions.
With Boeing boasting the best year-to-date performance in the Dow Jones, despite this week’s precipitous decline, the Industrial Average has had to come to terms with divergence, likely at a faster pace than usual. That said, a break above 2815 in the S&P 500 could see the indices drift further apart as the sentiment-leveraged growth appetite conflicts with targeted concerns for companies like Boeing to drag on the Dow.
--Written by Peter Hanks, Junior Analyst for DailyFX.com
Contact and follow Peter on Twitter @PeterHanksFX
Read more: Stock Market Fund Flows: S&P 500 Retreat Sparks Demand for Defensives
DailyFX forecasts on a variety of currencies such as the US Dollar or the Euro are available from the DailyFX Trading Guides page. If you’re looking to improve your trading approach, check out Traits of Successful Traders. And if you’re looking for an introductory primer to the Forex market, check out our New to FX Guide.


