


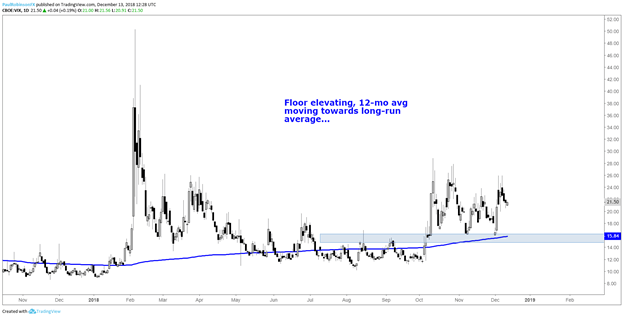
Coming into last year I was looking for equity market volatility to rise from levels not seen since the 1960s, as well as a market decline. The floor in volatility did indeed rise and looks set to remain elevated in 2019 (and beyond). The 12-month average level of the VIX is rising back in-line with its long-run average, but still not quite there.
Using the often cited 200-day MA as a measuring stick for defining bull market and bear market phases, the long-term average for the VIX when the S&P 500 is above the 200-day is 16.6 and when it is below the 200-day MA the average value of the VIX rises to 27. You could say volatility is only starting to normalize by historical standards, which is a good thing for trading.
CBOE VIX Chart - Volatility Normalizes, to Stay Elevated: Daily Timeframe (October 2017 to December 2018) (Chart 1)
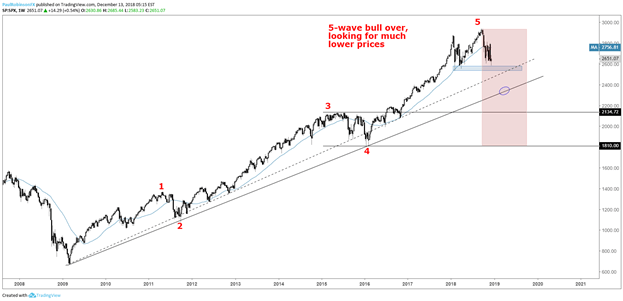
With regards to market direction, my confidence level in seeing a sharp break in equity prices is much higher than it was prior to 2018, with a decline seen as likely deepening well into bear market territory (-20% or greater). A 5-wave move from the 2009 low looks to finally be complete.
A drop to the bull market trend-line off the 2009 low will have the S&P down approximately 20% off the high (depending on the timing), but a drop to price levels not seen since the last bull market correction (2015/16) look to be in the cards as massive excesses get purged. If this turns out to be the case then the S&P 500 will be trading down to the 2134/1810 area, or 27% to 38% off the highs. I’m no economist, but a drop of that severity also means a recession will likely be upon us.
US S&P 500 Price Chart - Looking for Much Lower Prices: Weekly Timeframe (October 2008 to December 2018) (Chart 2)
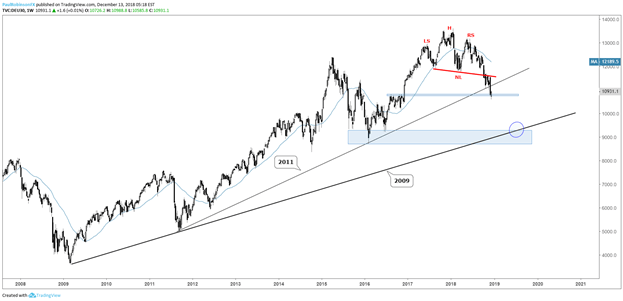
The DAX is set to continue its woes as not only is it already further off the highs than the S&P 500 (severe relative weakness), but the size of the head-and-shoulders pattern dating back to June 2017 suggests a major macro top will have the German benchmark continuing to reel. The bull market trend-line off the 2009 bottom and lows from the 2015/16 correction, both around the 9k mark, are viewed likely to be met.
German DAX Price Chart - H&S to Lead to Bull Market Trendline: Weekly Timeframe (October 2008 to December 2018) (Chart 3)
To see all of the analysts Top Trade Ideas for 2019 and Top Lessons from 2018, download the guides on the DailyFX Trading Guides Page.


