Brent Oil, Crude Oil (WTI) and US Oil Prodcution:
- Economic slowdown fears weigh on oil.
- Record US shale output floods the market.
Q4 Trading Forecasts including Oil.
Brent Crude Hit by Economic Slowdown and US Glut
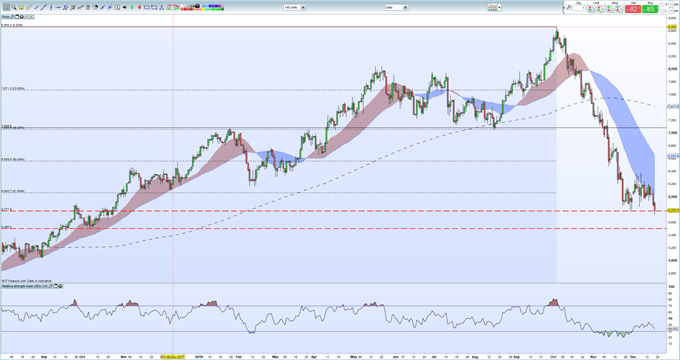
Brent crude has made a fresh 14-month low in early trade Tuesday as the oil complex continues to weaken on news that the US shale sector hits record production, while fears of a global economic slowdown continue to be priced into the market. The US, now a net oil exporter, is expected to pump a record amount of shale oil, according to official data. The US Energy Information Agency said on Monday that US shale oil production is expected to rise to 134,000 barrels m/m to 8.166 million, the first time the monthly average will have topped 8 million. This record glut has pushed both US crude (WTI) and Brent crude prices sharply lower in the last four daysdespite the recent output cuts agreed at the OPEC+ meeting earlier this month. Brent crude is currently quoted 1.64% lower at $57.70/bbl. while US crude (WTI) is 2.1% lower at $48.60/bbl.
WTI vs Brent – Top 5 Differences Between WTI and Brent Crude Oil
Brent crude is now looking at the next horizontal support level at $54.pp/bbl. made on October 6 and October 9, 2017. Resistance is set at $60.63/bbl. the 61.8% Fibonacci retracement level off the June 2017 – October 2018 rally.
How to Trade Oil – Crude Oil Trading Strategies
Brent Crude Oil Daily Price Chart (August 2017 – December 18, 2018)

Retail traders are 89.6% net-long US Crude Oil according to the latest IC Client Sentiment Data, a bearish contrarian indicator. However, recent changes in daily and weekly positions currently give us a stronger negative trading bias.
Traders may be interested in two of our trading guides – Traits of Successful Traders and Top Trading Lessons – while technical analysts are likely to be interested in our latest Elliott Wave Guide.
What is your view on Oil – bullish or bearish?? You can let us know via the form at the end of this piece or you can contact the author at nicholas.cawley@ig.com or via Twitter @nickcawley1.


