


US Dollar Price and Chart:
- US dollar basket (DXY) breaks trend as US Treasury yields fall.
- Will Fed Chair Powell and/or NFPs support the flagging USD?
We have just released our Brand New Q4 USD Trading Forecasts.
*** Amendment - Fed Chair Powell will not be giving his Testimony on Wednesday due to the Washington memorial for former President George Bush ***
US Dollar (DXY) Breaks Trend
The flattening of the US Treasury yield curve in the short-end andthe overall drop in yields has sent the US dollar (DXY) spinning lower as rate hike expectations in 2019 continued to be lowered. The closely watched UST 2yr-5yr spread has inverted – 2.817% vs. 2.805% - hinting that interest rates will need to be lowered in the future. The 10-year US Treasury currently trades with a yield of 2.95%, way below the recent 3.245% high seen in early November, again suggesting that further down the line, interest rates will need to fall. Yield curve inversion – when shorter-dated bonds yield more than longer-dated bonds – normally precedes the end of monetary tightening as it is seen as a predictor of an upcoming recession. In addition, in November Fed Fund implied rate hike expectations pointed to another 0.25% rate hike this month – still expected – while the 3-4 rate hikes expected in 2019 have now been pared right back to just over one hike in 2019.
Ahead this week, Fed Chair Jerome Powell’s testimony is released on Wednesday, ahead of the Beige Book, while on Friday the last non-farm payroll release of 2018 will show the latest state of the US jobs market and the increasingly important average hourly earnings.
According to the latest CFTC speculator positioning report, US dollar long positions have edged lower from the 18-month high seen in early December.
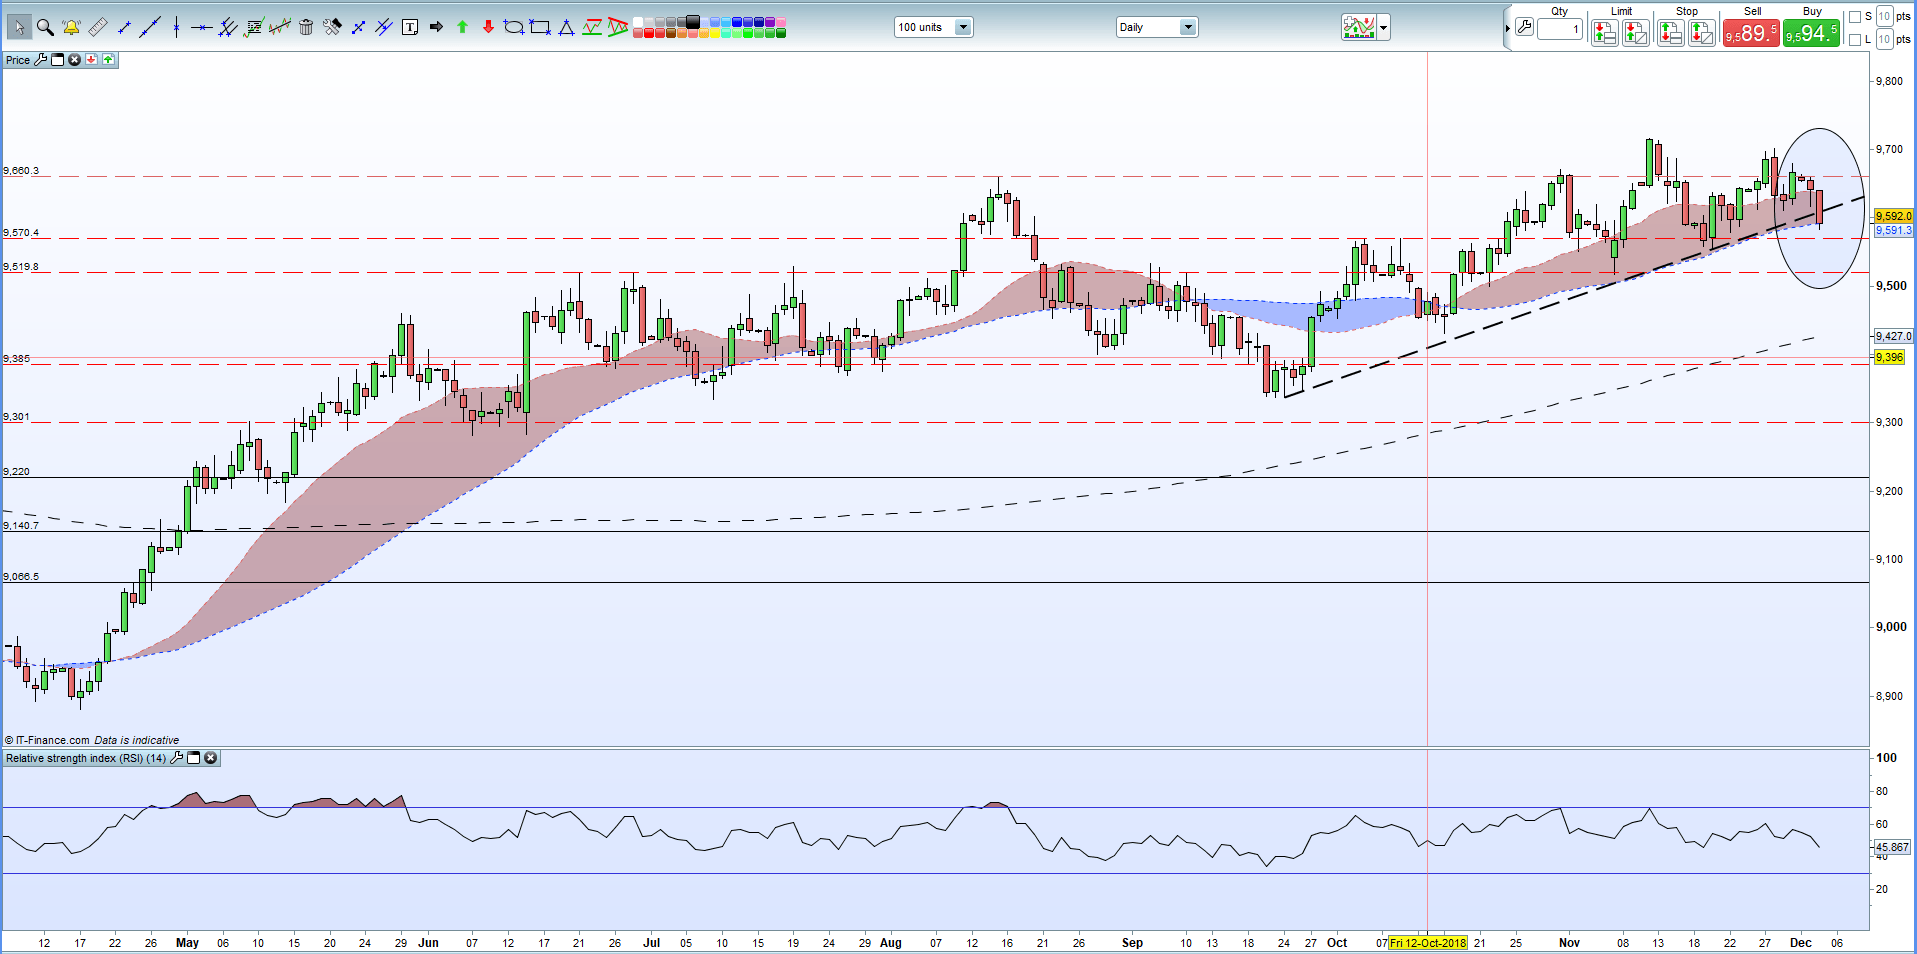
The US dollar basket (DXY) has now traded through its supportive trendline and may fall further ahead of Powell’s testimony and NFPs. It has also broken through the 50% Fibonacci retracement level and both the 20- and 50-day moving average, highlighting current weakness in the market. Initial support around 95.70 before the 95.20 area comes into play.
US Dollar (DXY) Daily Price Chart (April – December 4, 2018)
Traders may be interested in two of our trading guides – Traits of Successful Traders and Top Trading Lessons – while technical analysts are likely to be interested in our latest Elliott Wave Guide.
What is your view on the US Dollar – bullish or bearish?? You can let us know via the form at the end of this piece or you can contact the author at nicholas.cawley@ig.com or via Twitter @nickcawley1.


