


Australian Dollar and US-China Trade Tariffs
- China and the US agree to halt new tariffs for 90-days.
- AUDUSD downtrend broken but resistance nears.
We have just released our Brand New Q4 Trading Forecasts including USD and AUS.
AUDUSD Rally Boosted by US -China Trade Talks
AUDUSD rose sharply over the weekend after the US said that it would not impose new trade tariffs of 25% on Chinese goods for another 90-days, bringing hope that the two sides can dial down further trade tensions. President Trump said that tariffs on $200 billion of Chinese goods would stay at 10% into 2019, while China said that it would look at buying large amounts of agricultural products from the US in the very near-future.
The announcement of this 90-day cooling-off period has given risk assets a healthy push higher, while the Australian dollar - a proxy for Chinese trade - has also pushed higher, continuing its recent rally. On the daily chart the Australian dollar is getting short-term support against the US dollar from the 200-day moving average which it is now trading back above for the first time since April. The RSI indicator suggests the pair are becoming overbought, while there is a zone of resistance between 0.7484 and 0.7529.
AUDUSD Daily Price Chart (April – December 3, 2018)

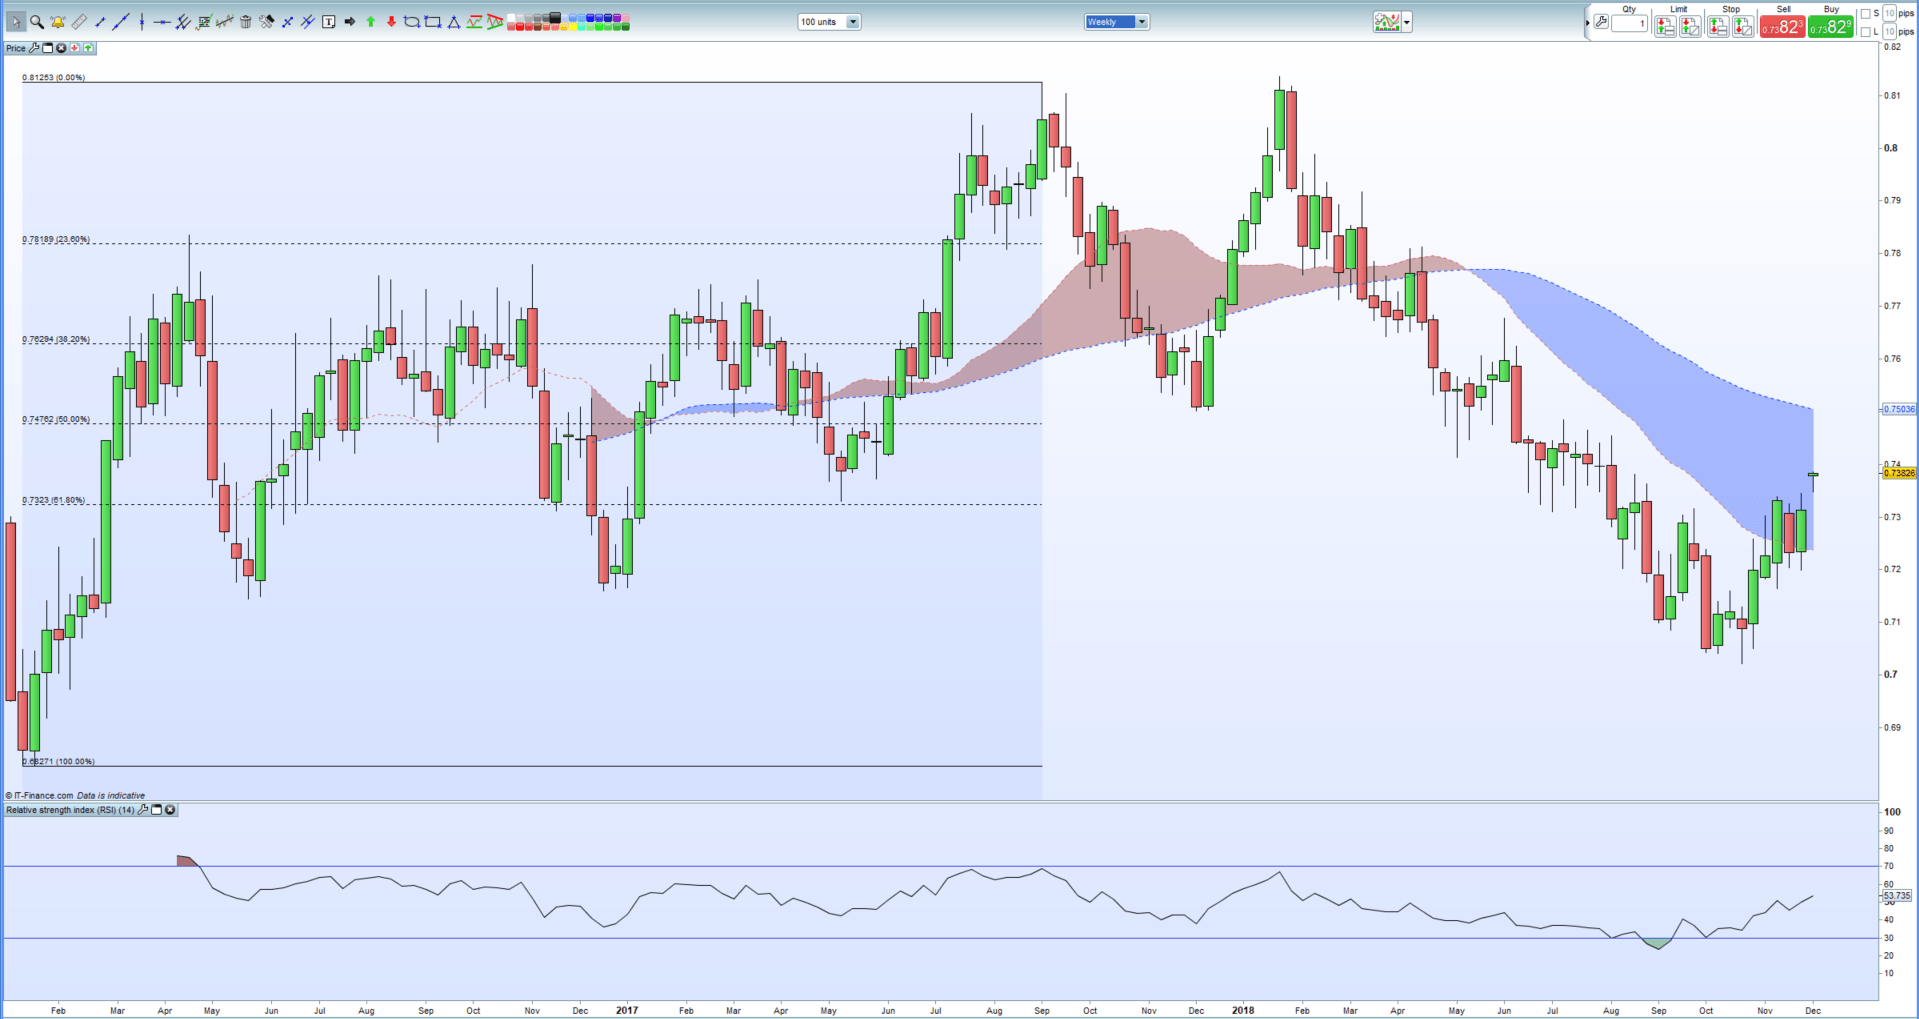
On the weekly chart, 50% Fibonacci resistance at 0.74762 may hamper upside progress, although the chart shows the downtrend is now broken. The RSI indicator is also looking positive and still has further upside before it nears overbought territory.
AUDUSD Weekly Price Chart (January 2016 – December 3, 2018)
IG Client Sentiment Data shows how retail are positioned in a wide range of currency pairs, commodities, cryptocurrencies and indices.In addition to outright positioning, the data show daily and weekly positional changes which give more color about retail sentiment.
Traders may be interested in two of our trading guides – Traits of Successful Traders and Top Trading Lessons – while technical analysts are likely to be interested in our latest Elliott Wave Guide.
What is your view on AUDUSD – bullish or bearish?? You can let us know via the form at the end of this piece or you can contact the author at nicholas.cawley@ig.com or via Twitter @nickcawley1.


