


Talking Points:
- Apple displayed significant resilience in the recent rout, especially compared to sector peers
- Over 50% of companies on the S&P 500 have reported their third quarter earnings with 83% delivering a positive surprise
- The general consensus of Q3 earnings season has begun to sway to the bullish side despite the rocky start and Apple’s miss
Equities Receive an Earnings Boost
Equity markets closed solidly in the green Thursday, a welcome and strong start for November. After the close the largest publicly traded company in the United States, Apple (AAPL), reported their fourth quarter earnings. The report has been highly anticipated as investors and speculators alike look to the Cupertino, California based company to weigh in on its past performance and future outlook. Unfortunately for broad market bulls and AAPL holders, Apple fell short of market expectations.
Apple Price Chart November 1st (Chart 1)
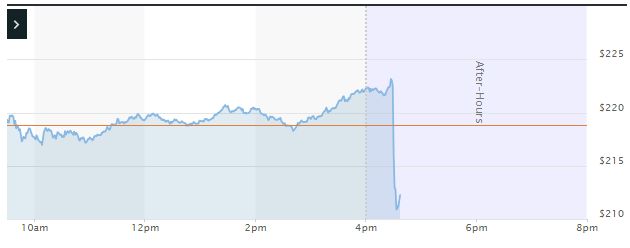
Chart provided by MarketWatch
Revenue read in above expectations at $62.9 billion versus analyst expectations of $61.44 billion. Earnings per share similarly surprised with $2.91 versus $2.79 expected. After ending Thursday in the green, Apple shares traded lower in after-hours, looking to retrace earlier established gains. Still, the results on paper were promising.
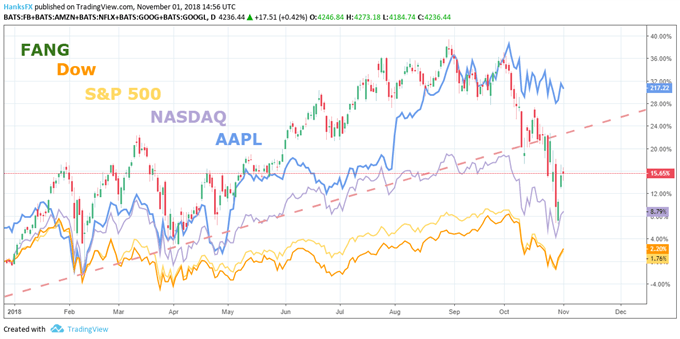
A key reason behind the market’s disappointment was not past performances but future expectations. Apple announced their first quarter revenue outlook for 2019 to be between $89 billion and $93 billion. Analysts forecasted Q1 revenue to be $92.7 billion. While within range but to the lower side, the market’s response highlights the strict standards applied to such a massive corporation. Still, Apple has fared far better than most companies in the recent rout, especially tech-sector peers.
FANG Price Chart Daily, Year-to-Date (Chart 2)
Join our analysts for Live Webinars that range from live coverage of central bank decisions and economic data breakdowns to trading Q&A’s.
With a market cap north of $1 trillion, Apple boasts significant sway in the NASDAQ index and many exchange traded funds. With that in mind, the outlook miss and subsequent response will surely influence broader equity markets on Friday and sentiment moving forward.
Still, Apple is yet another company to deliver a positive surprise on their quarterly earnings from a trailing data perspective, a trend that has now pushed the season to the bullish side. Despite the rough start and the precipitous declines witnessed in global equity markets, this earnings season has been largely positive. As of November 1st, roughly half of the companies in the S&P 500 have reported earnings. Of those that have reported, 83% of them have delivered positive results.
The bullish leaning of the season has likely played a large part in the recent rebound for US equities as they begin to find their footing. Another contributor to the rebound may be the market’s sentiment regarding trade wars.
Metal Tariffs and the US-China Trade War
President Trump and Chinese President Xi Jinping have expressed a willingness to meet at the G20 summit in late November. A meeting between the two trade war adversaries will surely garner significant attention globally. With that in mind, optimism from President Trump regarding the proposed meeting did its part to lift sentiment.
United States Steel (X) Daily Chart, Year-to-Date (Chart 3)

Another factor on the trade war front is how companies impacted by the tariffs are faring. United States Steel (X) also reported earnings after the close Thursday. With steel and aluminum tariffs entering their 8th month, the company has had time to forecast accordingly and should surely have felt the full pressure of the tariffs. Compared to the broader index, the metal tariffs have visibly weighed on the performance of US Steel.
Read up on the ongoing economic conflict between China and the United States with A Brief History of Trade Wars.
US Steel Price Chart, November 1st (Chart 4)

Chart provided by MarketWatch
Still, US Steel met EPS expectations at $1.76. The EPS figure is more than double that of last year’s which read in at $0.83 and offered a 20% surprise to analyst estimates. Despite that, shares of US Steel slumped slightly in after-hours trading.
View important upcoming events and market data on our Economic Calendar.
As Friday’s session approaches, Canadian unemployment and US unemployment data could deliver meaningful price action for the US Dollar and the Canadian Dollar as well as their respective equity markets. Similarly, the US trade balance could shed further light on the impact of the US-China trade war.
--Written by Peter Hanks, Junior Analyst for DailyFX.com
Contact and follow Peter on Twitter @PeterHanksFX
Read more: S&P 500, Dow Rout Allows Bold Investors to Pick up Cheap Shares
DailyFX forecasts on a variety of currencies such as the US Dollar or the Euro are available from the DailyFX Trading Guides page. If you’re looking to improve your trading approach, check out Traits of Successful Traders. And if you’re looking for an introductory primer to the Forex market, check out our New to FX Guide.


