


Gold Price Analysis and Talking Points:
- Gold Bullish on Risk Averse Environment
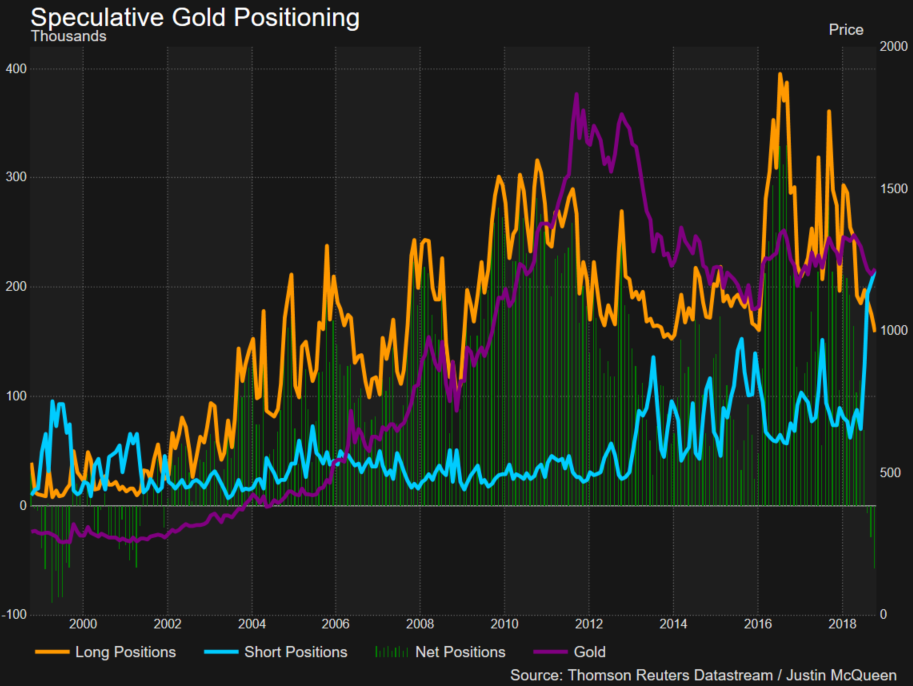
- Gold Net Shorts Highest Since 1999
See our quarterly gold forecast to learn what will drive prices through mid-year!
Gold Bullish on Risk Averse Environment
Last week’s equity market rout had finally reignited the safe haven demand into the precious metal, whereby gold prices saw its largest daily gain (October 11th) since the Brexit referendum. Since last week, the precious metal has extended on gains amid the ongoing soured sentiment, which in turn has led to a pullback in Federal Reserve rate hike expectations. Although, a December 2018 hike is priced in, markets have begun to reign in expectations of further Fed rate hikes next year, despite the central bank currently projecting 3 more rate rises (according to dot plot projections).
Gold Net Shorts Highest Since 1999
Gold prices are hovering around its best levels since July following an aggressive move higher in the precious metal from sub-$1200 to $1230. Alongside this, gold speculators currently hold the largest short bets on record with net shorts at the highest since 1999, when the price gold was $255. Subsequently, given the speculative positioning, gold could be vulnerable to an extended bullish breakout. Elsewhere, demand for the gold has firmed with the SPDR gold ETF holdings seeing inflows for the past 2 weeks (+2%).
GOLD PRICE CHART: Daily Time-Frame (November 2016-August 2018)
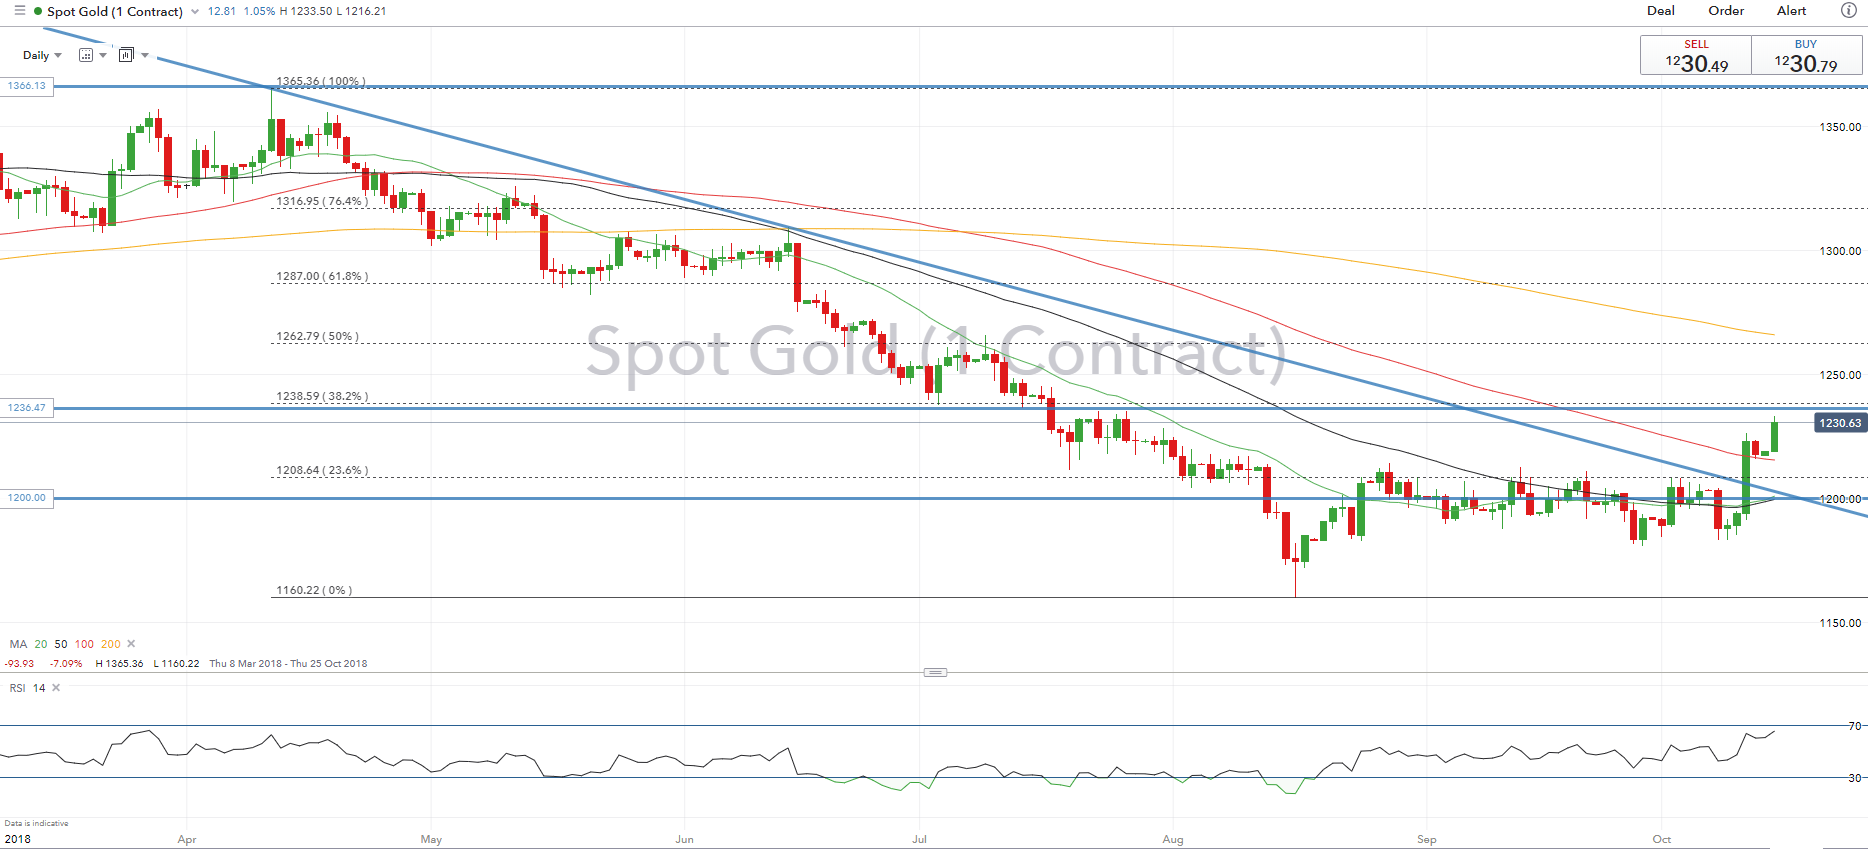
Bulls are firmly in control for the precious metal with 1240 the next target for gold (38.2% fibonacci retracement). A break and close above this level sets up a move towards key 50% fibo.
GOLD TRADING RESOURCES:
- See our quarterly gold forecast to learn what will drive prices through mid-year!
- Just getting started? See our beginners’ guide for FX traders
- Having trouble with your strategy? Here’s the #1 mistake that traders make
--- Written by Justin McQueen, Market Analyst
To contact Justin, email him at Justin.mcqueen@ig.com
Follow Justin on Twitter @JMcQueenFX


