


Euro and US Dollar Price, Charts and Analysis:
- EURUSD is leaning on support and a break lower could see the pair fall to 1.1300
- Italian bond yields continue to leak ever higher.
We have just released our Brand New Q4 Trading Forecasts including USD and EUR.
EURUSD Looking at Fibonacci Retracement
EURUSD continues to probe the downside as Italian government bond yields creep higher – the 10-yr now yields 3.60% - and the US dollar continues to gain strength. This situation has been played out over the last couple of weeks but EURUSD price action is now closing in on an important support level, which if broken could lead to a further, sharp, fall.
Euro negatives remain a weak Italian government bond market, fueled by ongoing budget concerns, a strong US dollar complex, driven by tighter US monetary policy and recent hawkish chatter from Federal Reserve speakers suggesting the US economy may be stronger, for longer.
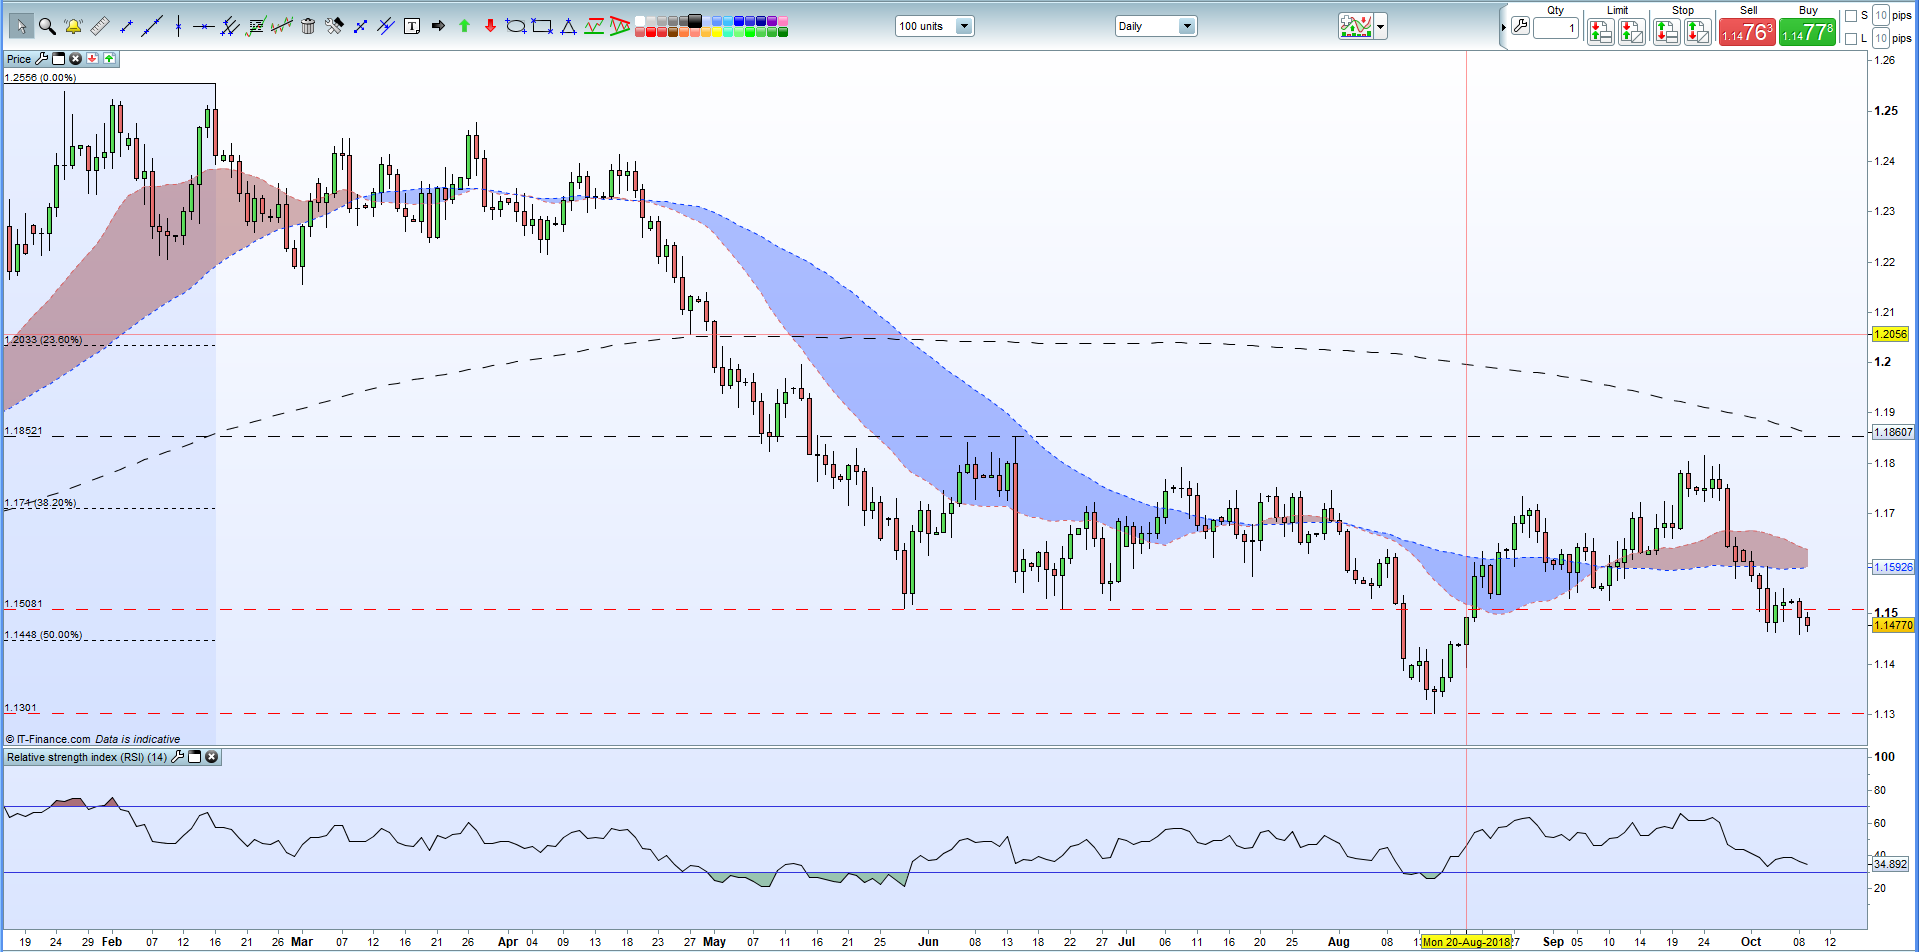
A look at the daily price chart shows the pair currently trading a fraction above the 50% Fibonacci retracement level of the January 2017 – February 2018 rally at 1.14480, a level neared four times in the last week. Below here there is very little price action ahead of the August 15 low – a 16-month nadir - at 1.13010
October 8 - EURUSD Remains Under Selling Pressure as Italian Bond Yields Jump
IG Client Sentiment Data show how investors are currently 57.5% net-long EURUSD and combined with recent positional shifts, we get a strong bearish contrarian trading bias.
EURUSD Daily Price Chart (January – October 9, 2018)
If we have a look at the four-hour chart we see a cluster of trades between 1.14599 and 1.14840 over the last six days, while the pair is also currently capped by the 20- and 50-day moving average cloud, as well as the important 200-day moving average.
According to the latest CFTC Commitment of Trader’s report (CoT), large speculators continue to shun the Euro and are 7,101 contracts short of the single currency this week – a near-52 week low - compared to a long position of 3,696 contracts in the prior week. At one stage earlier this year, speculators were long of 151,476 contracts.
EURUSD Four-Hour Price Chart (September - October 9, 2018)

Traders may be interested in two of our trading guides – Traits of Successful Traders and Top Trading Lessons – while technical analysts are likely to be interested in our latest Elliott Wave Guide.
What is your view on EURUSD – bullish or bearish?? You can let us know via the form at the end of this piece or you can contact the author at nicholas.cawley@ig.com or via Twitter @nickcawley1.


