Euro, US dollar and Italian Bond Yields Talking Points:
- Italian 10-year bond yield hits 3.50% -- nearly 300 basis points more than Germany.
- Robust US labor market underpins US dollar strength.
We have just released our Brand New Q4 Trading Forecasts including USD and EUR.
EURUSD Set for the Next Leg Lower
The Euro remains under pressure at the start of the week with Italian government bond yield rising further, dragging the 10-year BTP/Bund spread out to nearly 300 basis points, pointing to a weaker euro. The latest move higher in Italian yields reflects increasing concerns from the EU Commission that Italy’s budget is a ‘source of concern’ prompting fears of a showdown between the two. Italian 10-year yields have doubled since early May and are likely to test 4.00% in the short-term.
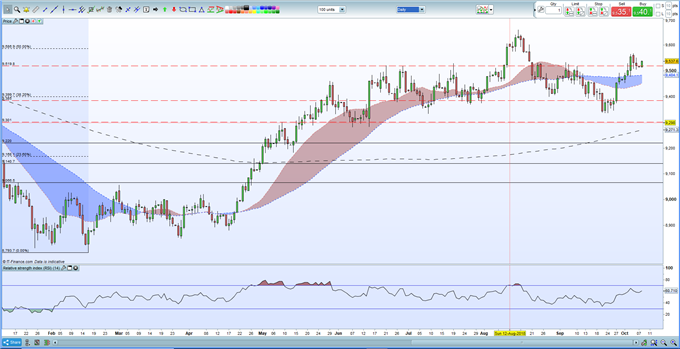
Friday’s non-farm payrolls report was a mixed bag with a lower headline jobs report print but a strong upward revision in the prior month and a near five-decade low in the unemployment rate. The US dollar basket (DXY) remains in good technical shape – comfortably above all three moving averages – and is looking to re-test the 50% Fibonacci retracement level at 95.87 which would leave 96.60 – a 16-month high – as the next target.
US Dollar Basket (DXY) Daily Price Chart (January 2017 – October 8, 2018)

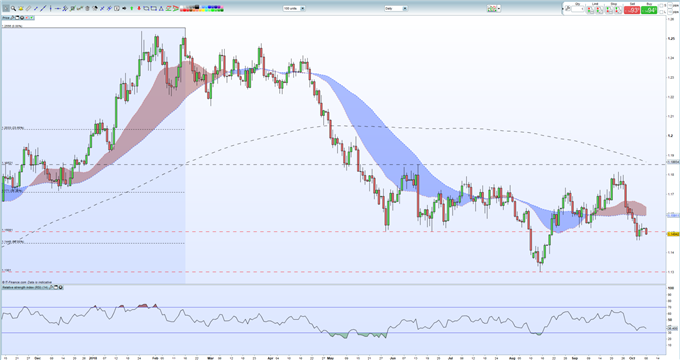
EURUSD continues to trade either side of 1.1500 with support seen at 1.1464 ahead of 50% Fibonacci retracement at 1.14480. If broken and closed below, then 1.1300 comes into play.
IG Client Sentiment Data shows how investors are currently 56.8% net-long EURUSD and combined with recent positional shifts, we get a strong bearish contrarian trading bias.
EURUSD Daily Price Chart (November 2017 – October 8, 2018)

Traders may be interested in two of our trading guides – Traits of Successful Traders and Top Trading Lessons – while technical analysts are likely to be interested in our latest Elliott Wave Guide.
What is your view on EURUSD – bullish or bearish?? You can let us know via the form at the end of this piece or you can contact the author at nicholas.cawley@ig.com or via Twitter @nickcawley1.


