


Gold Price News and Analysis
- Gold unable to breach the 200-day moving average.
- A new 2018 low may be made in the short-term.
The new DailyFX Q2 Gold Forecast is now available to help traders navigate the market.
The latest IG Retail Sentiment Indicator shows that traders are nearly 79% net-long of the precious metal, yet recent changes in net-longs give a mixed trading bias.
Gold Price May Fade Lower
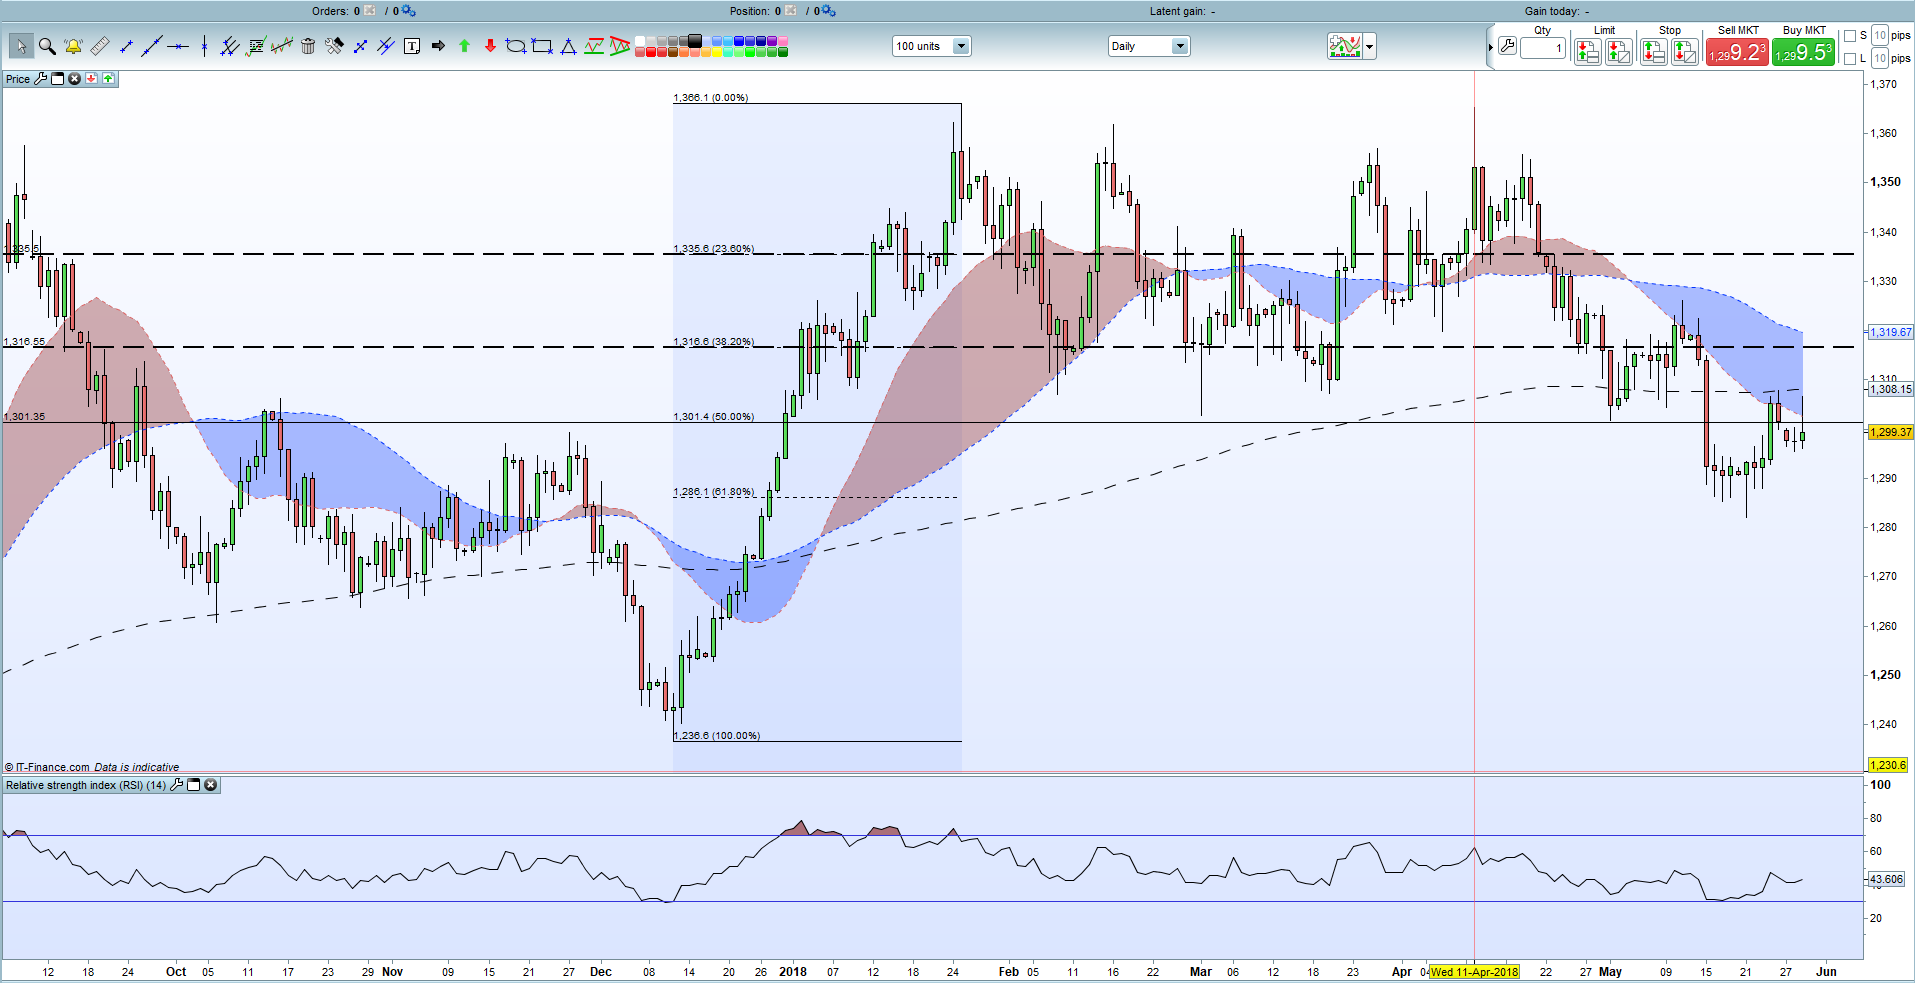
The spot price of gold is having difficulty trading back above the 200-day moving average, currently around $1,308/oz, despite other safe-haven assets getting a strong bid on the ongoing political turmoil in Italy. US Treasury yields have also been driven lower as investors shun risk, a situation that would normally see gold moving higher, yet price action is flat on the day. While the situation in Italy may calm over the next few days, in Spain there will be a vote of no-confidence in Prime Minister Mariano Rajoy on Friday. Rajoy who has ruled Spain since 2011 is under pressure after 29 people linked to his People’s Party were convicted of a series of crimes last week.
The long-term moving average, which provided support in the first two weeks of May has now turned into a strong resistance level and will need to be broken decisively if gold is to push ahead. A break above would leave $1,316 as the next upside target.
Gold currently trades just below the 50% Fibonacci retracement ($1,301.4/oz) of the December -January 2018 rally and is currently eyeing this year’s low at $1,281, around $5 below the 61.8% Fibonacci retracement at $1,286/oz.
Gold Spot Price Chart Daily Time Frame (September 6, 2017 – May 29, 2018)
Are you new to Gold or FX trading or are you looking to improve your trading skill sets? We can help you along your journey with a comprehensive range of constantly updated guides and trading tools – they are all Free to Download Here.
What’s your opinion on Gold?Share your thoughts with us using the comments section at the end of the article or you can contact the author via email at nicholas.cawley@ig.com or via Twitter @nickcawley1.
--- Written by Nick Cawley, Analyst


