


Bitcoin Chart and Talking Points
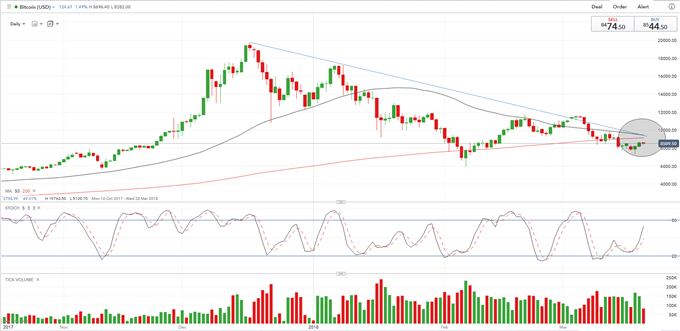
- The 50-day moving average is close to trading through (below) the 200-day moving average, a signal that normally gets bears growling.
- The downward channel from the December 17 high remains intact.
If you are interested in trading cryptocurrencies we have just released a new Guide to Day Trading Bitcoin and Other Cryptocurrencies to help you navigate the market.
Bitcoin Chart Signals That Lower Prices May Lie Ahead.
Bitcoin may be entering an extended period of lower prices, according to the latest chart, as two moving averages look to collide.The short-term 50-day ma is set to break below the 200-day ma, a bearish technical sign normally called a ‘death cross’.The negative cross-over is a sign of slowing momentum and normally points to lower prices. Thisparticular cross-over – if it happens - also coincides with downward trend channel which remains intact from the December 17 BTC at just under $20,000, with just a minor break out between March 4 and March 6. In the case of a death cross, the 200-day moving average becomes resistance with the current chart showing six candles closing below the 200-day ma already.
Normally a cross-over is accompanied by a rise in volume as sellers, or buyers in the case of a bullish ‘golden cross’, take over the market, something that is not seen on the latest BTC chart at the moment but should be monitored closely. On the downside, the March 18 low at $7322 may provide some support, but a break and close below could signal further losses down to the February 6 ‘spike low’ at $5931.
Bitcoin (BTC) Price Chart Daily Time Frame (October 16, 2017 – March 20, 2018)
We will be discussing a range of cryptocurrency charts and price set-ups at our Weekly Cryptocurrency Webinar every Wednesday at 12:00 GMT.
Bitcoin Bulls May Find Solace in Client Sentiment
A look at IG Client Positioning data show70.5% of traders are net-long with the ratio of traders long to short at 2.39 to 1. The number of traders net-long is 5.0% lower than yesterday and 1.9% lower from last week, while the number of traders net-short is 0.4% higher than yesterday and 16.6% higher from last week.
We typically take a contrarian view to crowd sentiment, and the fact traders are net-long suggests Bitcoin prices may continue to fall. Yet traders are less net-long than yesterday and compared with last week. Recent changes in sentiment warn that the current Bitcoin price trend may soon reverse higher despite the fact traders remain net-long.
Cryptocurrency Trader Resources – Free Practice Trading Accounts, Guides, Sentiment Indicators and Webinars
If you are interested in trading Bitcoin, Ethereum, Litecoin, Bitcoin Cash or Ripple check out our Introduction to Bitcoin Trading Guide.
What’s your opinion on Bitcoin – bullish or bearish? Share your thoughts and ideas with us using the comments section at the end of the article or you can contact me on Twitter @nickcawley1 or via email at nicholas.cawley@ig.com.
--- Written by Nick Cawley, Analyst.


