


Gold and US Treasury Markets Talking Points
- Gold’s recent rally may pause for breath but higher prices look likely in the longer-term if US recessionary fears continue to build.
- The US Treasury 2-year/10-year yield spread may narrow further but strong chart support will limit the move.
Gold Price Rally Nears Recent 20-Month High
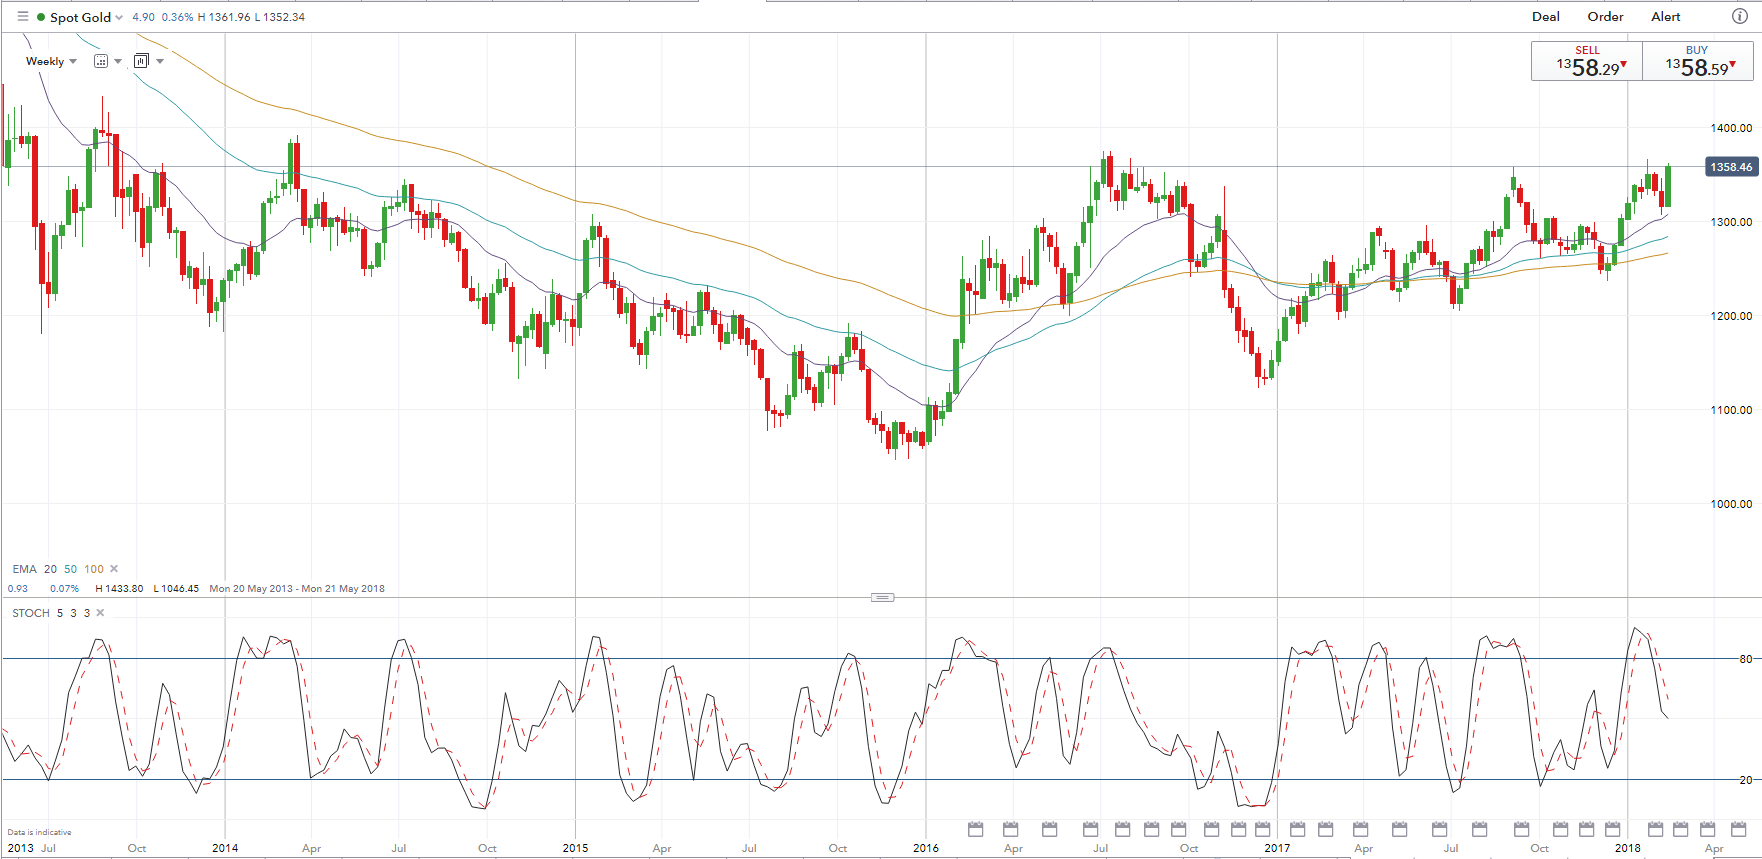
A weak US Dollar and increased worries that narrowing US Treasury yields spreads are pointing to a recession has seen spot gold gain around $120/oz since mid-December 2017. Gold is a traditional hedge used by investors when fears of a recession grow. On the weekly chart a break above the June 2016 double-top at $1,375/oz leaves the March 2014 high at $1,394/oz easily within reach, but the market may need to consolidate recent gains before it moves higher.
Inflation expectations in the US are also on the rise after recent hard data showed price pressures building, while the recent announcement of tax cuts and increased infrastructure spending also fueled fears of further price pressures. The market has priced in three 0.25% Fed rate hikes in 2018, yet despite this the path of least resistance for the greenback remains lower.
Spot Gold Price Weekly Chart in US Dollars (May 2013 – February 16, 2018)
Recessionary Fears Grow as US Treasury Yields Converge
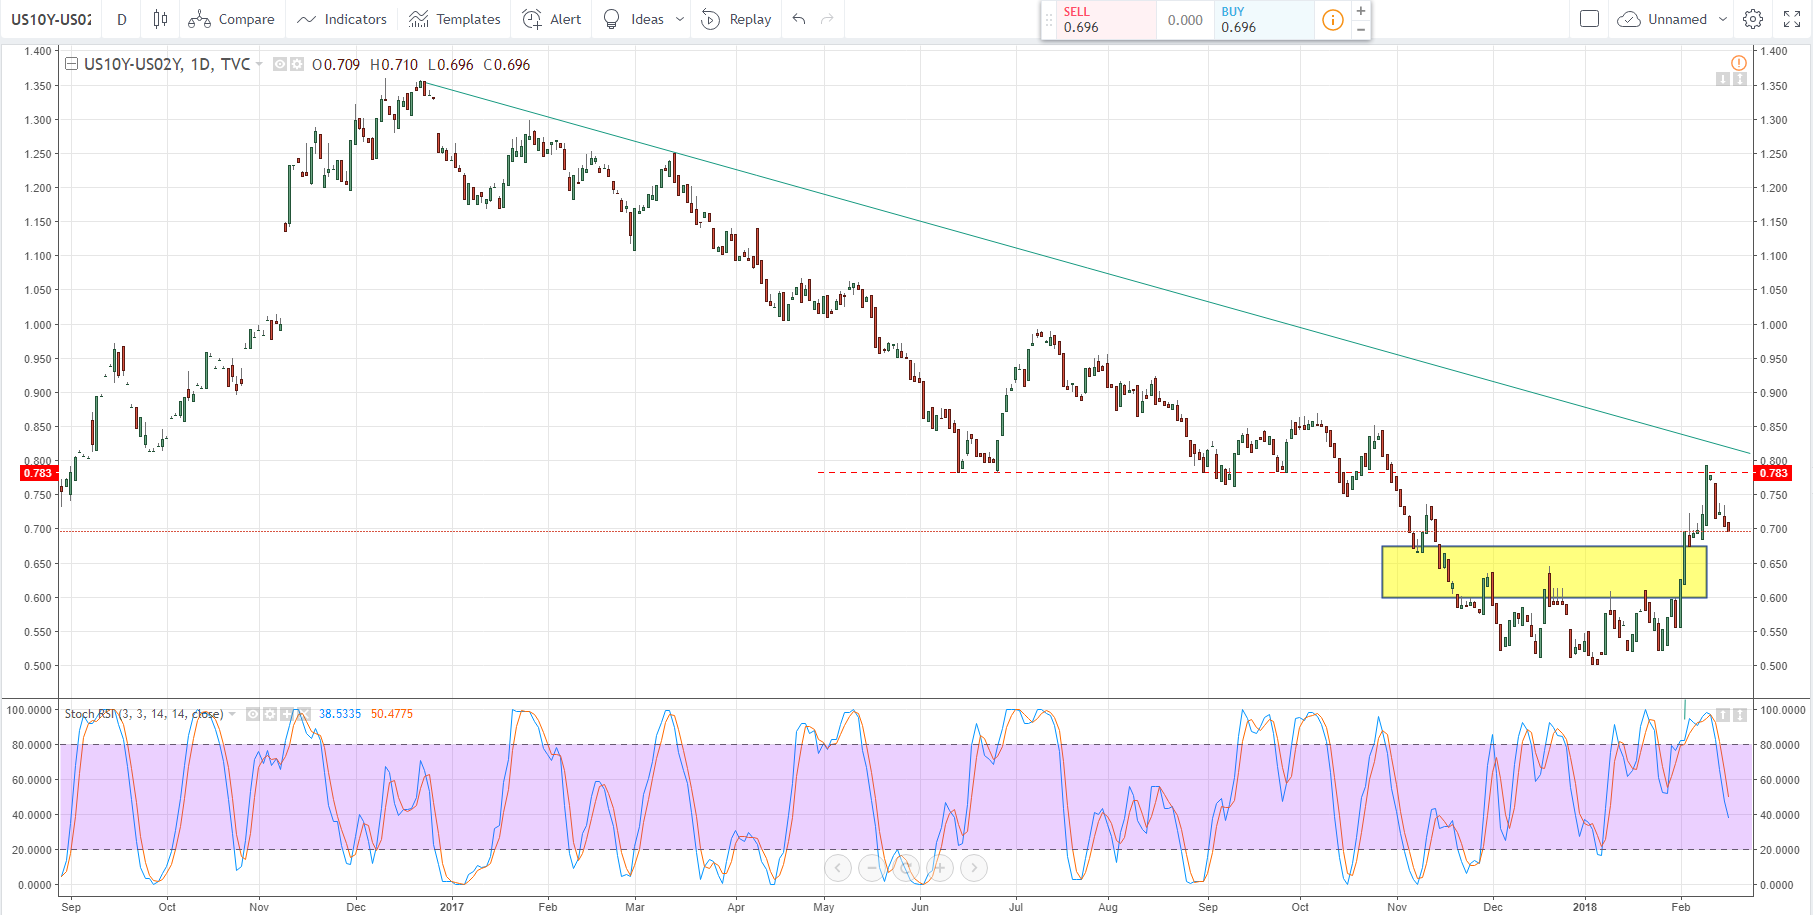
The chart below shows the yield diffeential between the 2-year and 10-year UJS Treasurys (10-year yield minus the 2-year yield), a traditional indicator of an upcoming recesion. When the spread between the two narrows (becomes smaller) recession fears increase. The spread is currently at 70 basis points, down from around 120 basis points at the start of 2017.
The recent widening of the spread is likely to come under pressure after rejecting the 78bp double low seen in mid-2017, while a gap on the chart between 60bpd and 68bps needs to be filled if any upside (widening) of the spread is to materialise. Strong support for the spread is seen at 50bps.
US Treasury 2-Year/10-Year Yield Spread Daily Chart (September 2016 – February 16, 2018)
Retail Gold Positioning Points to Lower Prices
IG Client Sentiment data show63.9% of traders are net-long Spot Gold with the ratio of traders long to short at 1.77 to 1. The number of traders net-long is 8.8% higher than yesterday and 8.3% higher from last week, while the number of traders net-short is 2.5% higher than yesterday and 6.1% higher from last week.
We typically take a contrarian view to crowd sentiment, and the fact traders are net-long suggests Spot Gold prices may continue to fall. Traders are further net-long than yesterday and last week, and the combination of current sentiment and recent changes gives us a stronger Spot Gold-bearish contrarian trading bias.
We have a wide range of Trading Forecasts and Guides available to help traders make more informed decisions.
--- Written by Nick Cawley, Analyst.
To contact Nick, email him at nicholas.cawley@ig.com
Follow Nick on Twitter @nickcawley1


