


Bitcoin News and Talking Points
- The cryptocurrency market continues to steadily re-coup recent losses.
- Bitcoin’s technical set-up paves the way for the market heavyweight to push higher.
Cryptocurrency Market Capitalization Grows in Settled Fashion
The market pullback from the recent lows of February 6 is characterized by a steady uptrend with little wild volatility associated with the space. All digital coins are higher in healthy turnover with any set-backs seemingly being used by traders to enter into new, or additional, long positions. The lack of any negative news is helping the push higher while a recent blog post from Microsoft suggesting that it will use Bitcoin as part of its plans to develop decentralized identities (DIDS) using blockchain technology may have also provided a positive boost.
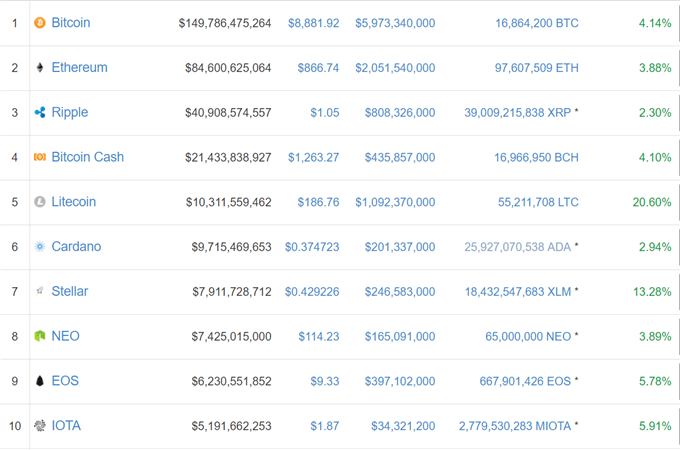
Top 10 Cryptocurrencies by Market Capitalization in US Dollars – February 14, 2018
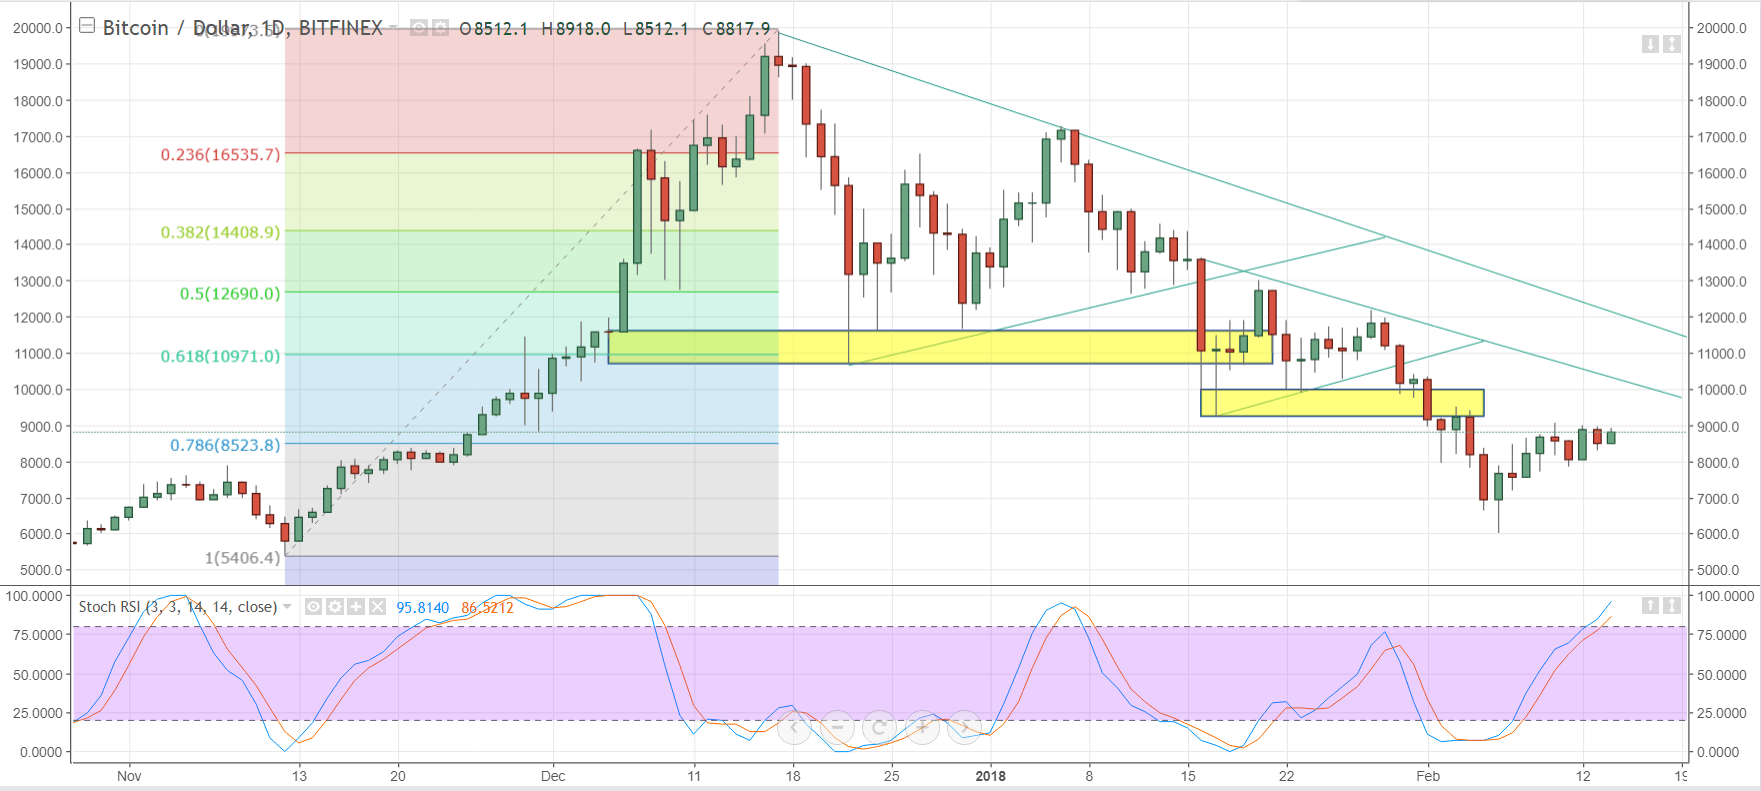
Bitcoin (BTC) Price Chart Producing Higher Lows
The updated BTC price chart shows positive momentum building in the digital coin. A series of four ‘higher lows’ in a row is a positive sign while the stochastic indicator confirms this recent trend. Ahead on the chart a zone of resistance between $9,300 and $9,900 nears with a clear break of this signaling a move to the 61.8% Fibonacci retracement level at $10,971. These upside targets may take a while to be hit as the overall pace – volatility – of the market has slowed which may provide better downside protection if the market falls back.
Bitcoin (BTC) Price Chart in US Dollars(October 28, 2017– February 14, 2018)
Cryptocurrency Trader Resources – Free Practice Trading Accounts, Guides, Sentiment Indicators and Webinars
If you are interested in trading Bitcoin, Bitcoin Cash, Ethereum, Ripple or Litecoin we can offer you a wide range of free resources to help you. We have an Introduction to Bitcoin Trading Guide. In addition we run a Weekly Bitcoin Webinar and have an IG Bitcoin Sentiment Indicator to help you gauge the market and make more informed trading decisions.
--- Written by Nick Cawley, Analyst.
To contact Nick, email him at nicholas.cawley@ig.com
Follow Nick on Twitter @nickcawley1


