


Bitcoin News and Talking Points
- Cryptocurrency losses extend the recent ‘lower high’ trend, sending prices spiraling lower.
- Technical chart indicator shows BTC, ETH and XRP are all heavily oversold.
Bitcoin (BTC), Ethereum (ETH) and Ripple (XRP) Prices Hammered Lower
The heavy sell-off in the cryptocurrency market continues, wiping hundreds of billions of dollars off the market capitalization. As we have underlined in the past two weeks, continued negative news flow – and a lack of any positive impulses – has rattled investors and sent them running to the exit. In addition the lack of any strong technical support levels of note have left traders at the mercy of aggressive sellers, especially when the market continues to be heavily overbought.
IG Client Sentiment data show that while traders may have been lightening up their positions, Ether and Ripple positioning would suggest that either the Hodlers are standing firm or traders are underwater and refusing to sell. Bitcoin positioning however has been reduced significantly over the last few days, indicating that two-way trade may be helping BTC find a natural equilibrium. Bitcoin positioning is 66.3% long, Ether is 91.2% long and Ripple is 94.8% long.
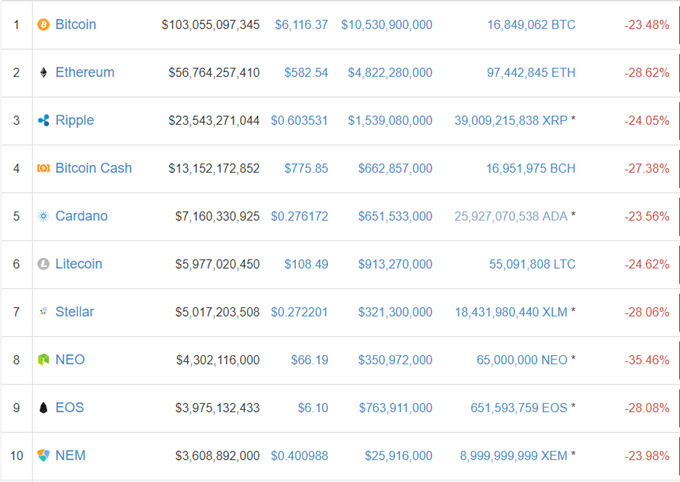
Top 10 Cryptocurrencies by Market Capitalization in US Dollars – February 6, 2018
Technical Indicator Hints that the Market is Oversold.
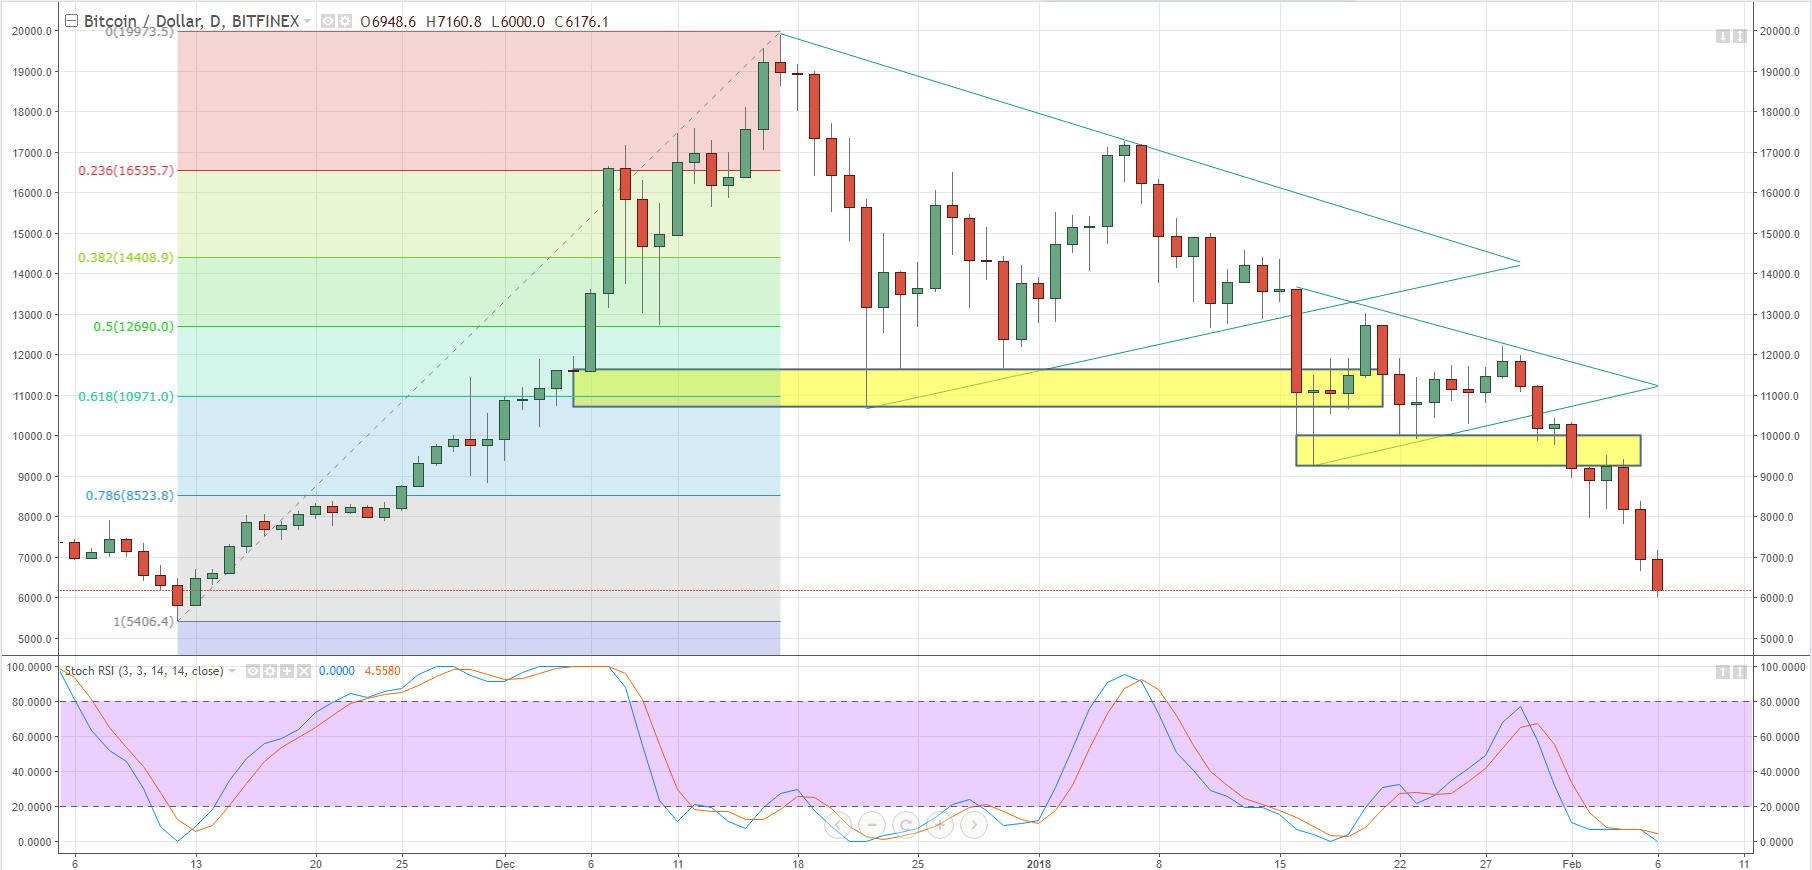
Looking at the three charts below, one common theme across them is that the stochastic indicator – at the bottom of the each graph – is stuck in heavily oversold territory, normally a signal that the market is due for a rebound. Stochastic is a simple momentum oscillatorthat can help determine when an asset or financial market is overbought or oversold.
Any uptick would be welcomed in the currently beleaguered market and may draw some buying interest back in, but the reprieve may still be temporary and prices will remain susceptible to additional sharp sell-offs.
DailyFX head foreign exchange instructor Jeremy Wagner has produced a detailed explanation on How to Trade with Stochastics as part of a series of technical articles that can be found in the DailyFX Education Center.
Bitcoin (BTC) Price Chart in US Dollars(November 5, 2017 – February 6, 2018)
Ethereum (ETH) Price Chart in US Dollars(October 13, 2017 – February 6, 2018)

Ripple (XRP) Price Chart in US Dollars (November 24, 2017 – February 6, 2018)

Cryptocurrency Trader Resources – Free Practice Trading Accounts, Guides, Sentiment Indicators and Webinars
If you are interested in trading Bitcoin, Bitcoin Cash or Ethereum we can offer you a wide range of free resources to help you. We have an Introduction to Bitcoin Trading Guide. In addition we run a Weekly Bitcoin Webinar and have an IG Bitcoin Sentiment Indicator to help you gauge the market and make more informed trading decisions.
--- Written by Nick Cawley, Analyst.
To contact Nick, email him at nicholas.cawley@ig.com
Follow Nick on Twitter @nickcawley1


