


Talking Points:
- The World Bank’s global growth outlook is reduced to 3.0% (previous estimate 3.4%)
- CBOE volatility index reaches highest level in a month
- Copper trades to a 5 ½ year low
Effects from slowed global growth have extended beyond the oil market; by association the price of copper, equites, and bonds have undergone significant changes. The directional movements have signified a growing discrepancy between supply and demand. The divergence has negatively affected the price of commodities and the volatility of equity markets as investors seek fixed-income assets.
In their most recent Global Economic Prospects report, The World Bank cut their global growth outlook from 3.4% (est. June) to 3.0%. Of notable interest, growth in China—the world’s largest economy—is expected to grow by only 7.1% this year after growing 7.4% in 2014. This figure marks the slowest pace of growth since 1990, when GDP expanded at a rate of 3.8%. Given China’s prominent position within international trade, the current and expected slowdown in their demand has negatively impacted not only global growth expectations but also the price of copper—a metal for which they consume 40% of supply.
With a high-low range of 2.616 to 2.406, copper has traded 8.0% lower today bringing the week’s total decline to 12.8%. At the lowest level in more than five years, copper’s slide can be attributed to both demand and supply side effects; the aforementioned decline in economic growth paired with a strong US Dollar accounts for the demand portion while heightened inventories can account for the supply portion. As reported by the Chilean Copper Commission, inventories among registered metal exchanges were elevated by 3.2% at the close of last week.
Such marked movement in the price of oil and copper are reflected in the CBOE VIX and consequently yields. With volatility having reached its highest level in a month, the S&P 500 index has once again fallen below 2,000 and the Dow Jones has dropped nearly 300 points from Tuesday’s close. As a result of falling commodity prices and high volatility, bonds have become more appealing; yields on the 10 Year US Treasury have remained below 2.0% since Friday.
Copper Daily Chart
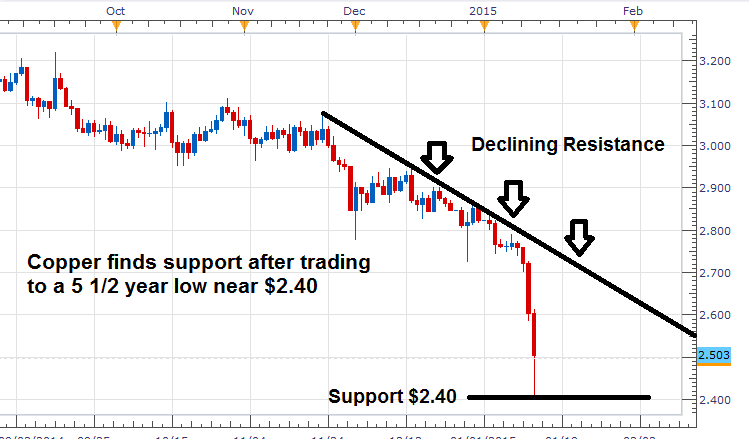
Chart Created by Walker England Using MarketScope2.0


