


US DOLLAR RALLY PAUSES AS AUD/USD & GBP/USD PRICE GAIN GROUND, USD/CAD DROPS
- USD price action set to peel back 0.8% as US markets come online for Friday’s trading session
- A surging US Dollar has launched the DXY Index nearly 8% higher off its month-to-date low
- GBP/USD spikes higher as AUD/USD finds relief from recent selling pressure while USD/CAD reverses
An incredible rally in the US Dollar over the past two weeks is on pace to finish today’s trading session on its back foot. The broader DXY Index has climbed more than 7% since the March 09 intraday low due to a surging US Dollar against major peers.

Amid the coronavirus pandemic and pessimistic market sentiment, the US Dollar has gained ground largely on the back of its premier status as a safe-haven currency.
DXY – US DOLLAR INDEX PRICE CHART: WEEKLY TIME FRAME (OCT 2016 TO MAR 2020)
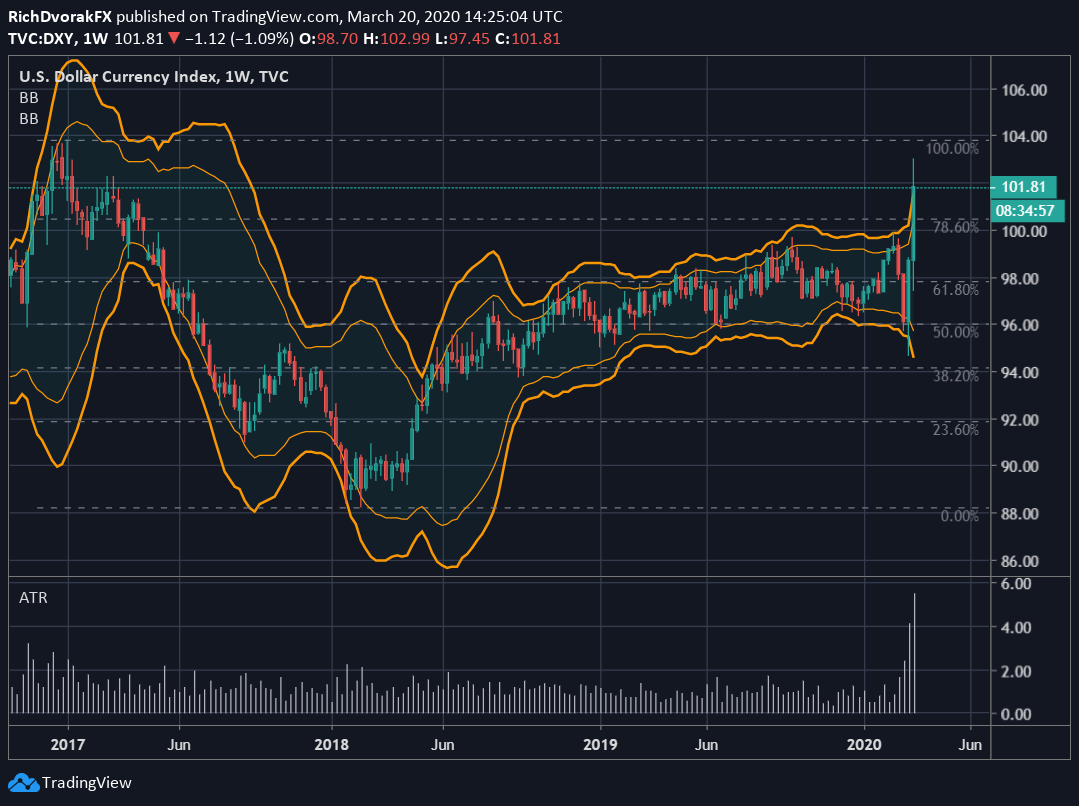
The jump in the US Dollar over the last two weeks has pushed the DXY above 100 and to a three-year high. Although, the staggering spike in USD price action has pushed the US Dollar Index above its 2-standard deviation and 3-standard deviation Bollinger Bands.

That said, a consolidation and mean-reversion lower in the US Dollar Index could be in the cards. This is considering the 95% and 99.7% statistical probabilities that price action will be contained within its 2-standard deviation and 3-standard deviation Bollinger Bands, respectively. Although, as FX volatility climbs, which is also indicated by the expanding weekly average-true-range, there is potential that the US Dollar surge will resume.
GBP/USD PRICE CHART: 2-HOUR TIME FRAME (MARCH 08 TO MARCH 20, 2020)
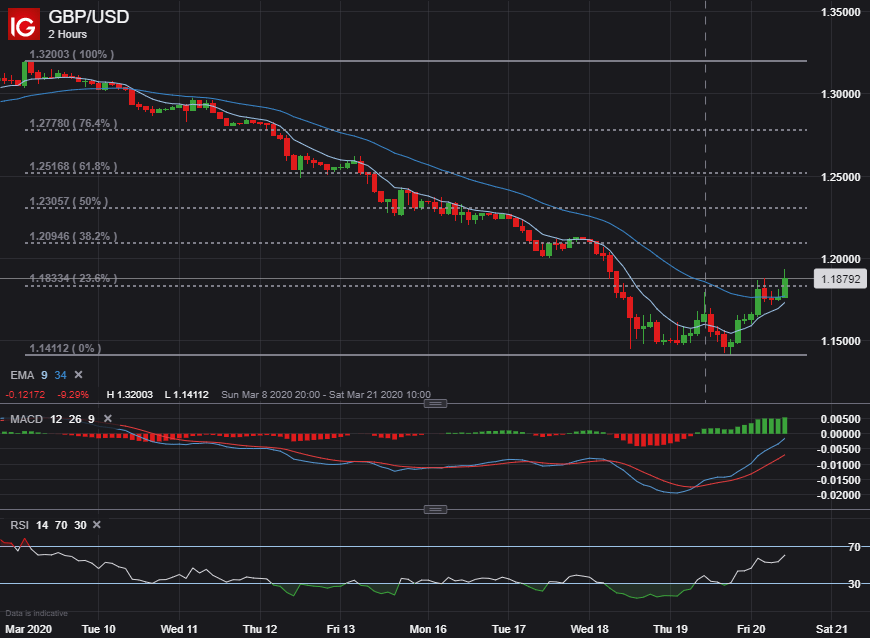
With the Pound Sterling comprising 11.9% of the US Dollar Index, it comes as little surprise that the US Dollar benchmark is up nearly 8% off its month-to-date lows after GBP/USD price action sank almost 1,800 pips in just 10 trading days.
| Change in | Longs | Shorts | OI |
| Daily | 3% | -7% | -3% |
| Weekly | 4% | -10% | -5% |
GBP/USD looks like it is beginning to rebound, however, with the Pound Sterling turning against the US Dollar. Gains in GBP/USD follow an emergency interest rate cut and liquidity injection by the BoE. Spot GBP/USD prices now trade above its 9-period and 34-period exponential moving averages.
AUD/USD PRICE CHART: 4-HOUR TIME FRAME (MARCH 06 TO MARCH 20, 2020)

Recent downside in the Australian Dollar, which pushed AUD/USD to fresh lows and its weakest reading since September 2002, has slowed after a short-term relief bounce off the 0.5600 price level. Although AUD/USD selling pressure started to abate yesterday after the RBA announced a comprehensive support package, spot prices seem to have found resistance around the 0.6000 handle – a major zone of technical confluence underpinned by the 38.2% Fibonacci retracement of the Aussie-Dollar’s latest bearish leg.

The Australian Dollar might remain under pressure, however, if markets remain risk-averse as the coronavirus outbreak, its economic toll worsens, and currency volatility continues to run rampant. On the other hand, bullish divergence on the MACD indicator is positive technical development as spot AUD/USD price action reclaims its 9-period exponential moving average.
USD/CAD PRICE CHART: WEEKLY TIME FRAME (OCTOBER 2015 TO MARCH 2020)
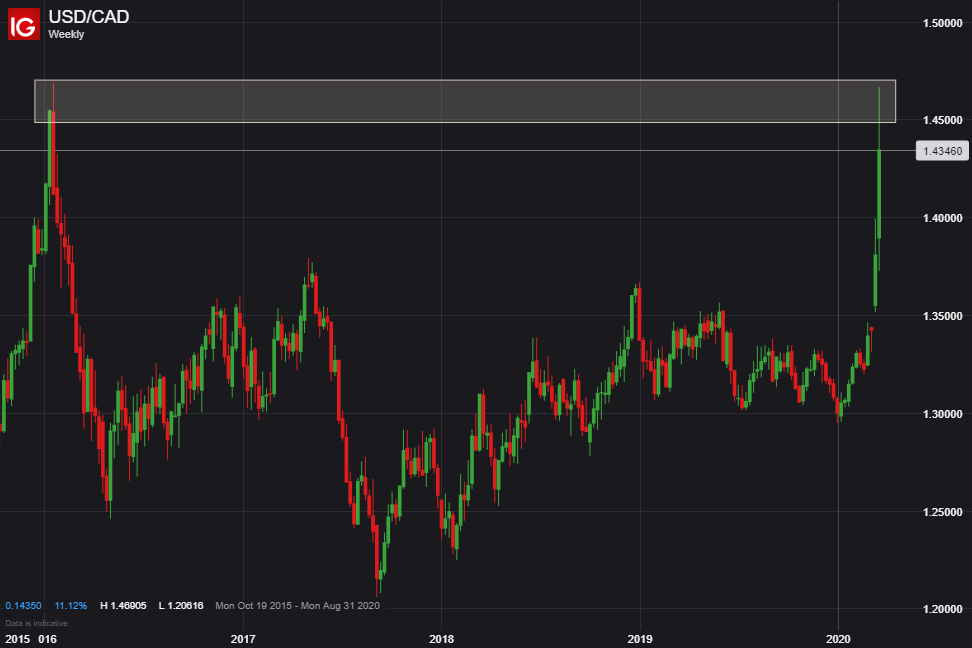
USD/CAD price action has snapped back lower after the US Dollar exploded 10% against its Canadian Dollar counterpart this month alongside the crash in crude oil. After surging to its highest reading since January 2016, spot USD/CAD seems to have run into a major level of technical resistance underpinned by this four-year high slightly above the 1.4500 handle.
| Change in | Longs | Shorts | OI |
| Daily | -2% | 7% | 5% |
| Weekly | -30% | 38% | 13% |
Nevertheless, the US Dollar could continue surging versus the Loonie and other currencies tied to economies heavily dependent on oil exports if the Saudi Arabia oil price war is sustained for much longer.
-- Written by Rich Dvorak, Junior Analyst for DailyFX.com
Connect with @RichDvorakFX on Twitter for real-time market insight


